2024 Third report complement
This page describes the prediction method used in the third report of this year’s sea ice forecast.
About the method
Arctic sea ice begins to decrease around June, and by July the open water expands in many places along the Russian and Alaskan coasts. In areas where sea ice has disappeared earlier than normal, it is thought that sea ice is also melting earlier in the surrounding areas. In addition, the faster the sea ice disappears, the more solar radiation is absorbed by the open water surface, and this also promotes sea ice melting in the surrounding area. Based on these, it is expected that there is a correlation between the sea ice extent in July and the subsequent summer months.
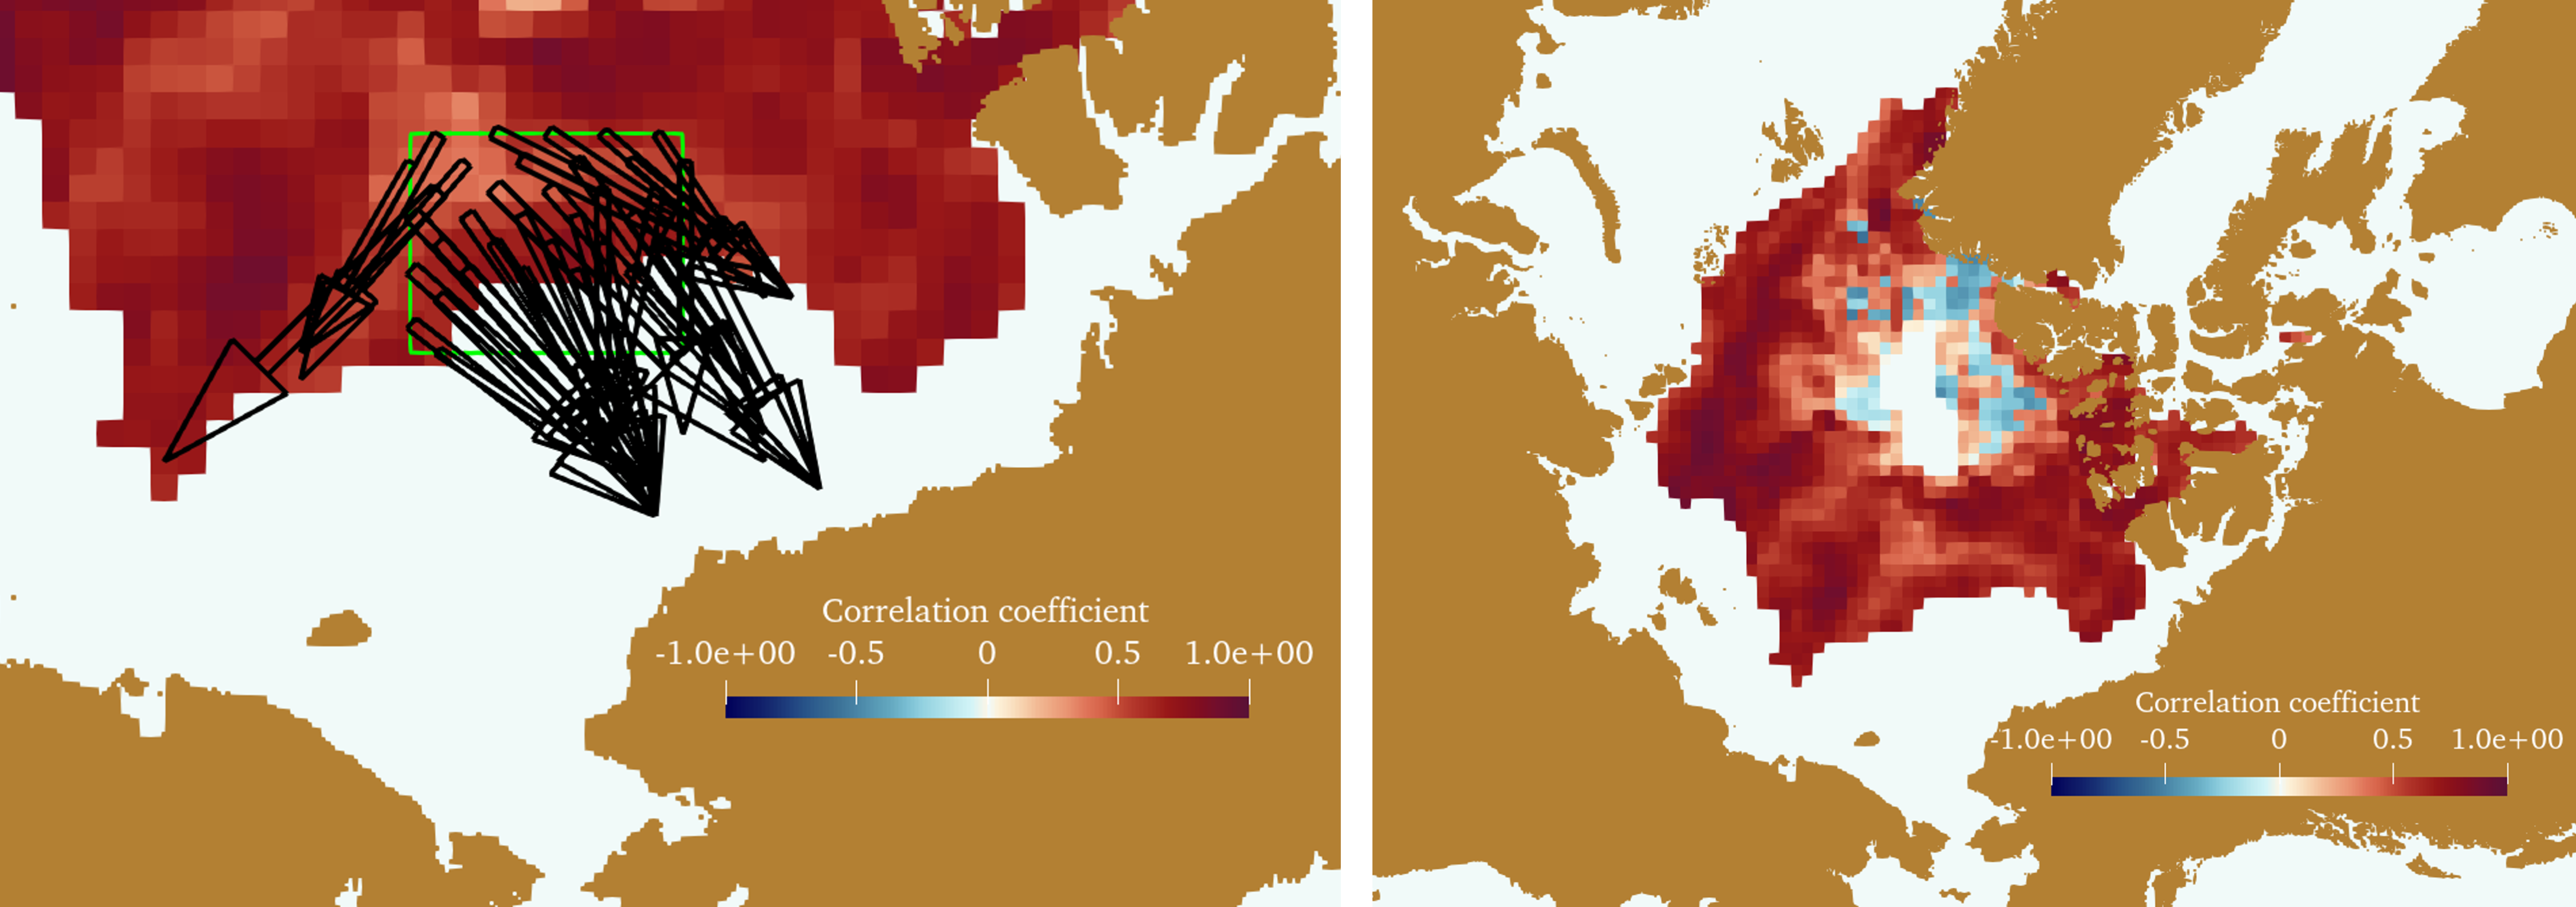
The specific method will be explained here using the example of predicting sea ice concentration on September 10 based on sea ice concentration on July 26. First, we determine which point’s sea ice concentration on July 26 will be used to predict ice concentration in September. For this purpose, the correlation coefficients between the ice concentration at the predicting point on September 10 and the ice concentration on July 26 at points within a radius of 600 km from the predicting point were calculated, and the point with the highest correlation was found. Next, we derived a linear relationship between the ice concentration on July 26 at the point with the highest correlation and the ice concentration on September 10 at the predicting point, using the data since 2003. Using this equation, we predicted the sea ice concentration on September 10 from the sea ice concentration on July 26 of this year. Figure 1 shows the pairs of positions with the highest correlation coefficients as arrows pointing from the September 10 predicting point to the July 26 reference point. The color map in Figure 1 right shows the values of the highest correlation coefficients. We find a high correlation between sea ice concentration in July and September in many locations. In the third report of this year’s sea ice forecast, 10 predictions were calculated for each point based on the reference ice concentration over a 10-day period from July 17 to 26, and the average of these predictions was used as the final prediction. This is to eliminate variations in prediction values due to coincidental high correlations, as shown in Figure 2.
Quick comparison with the past methods using observed values
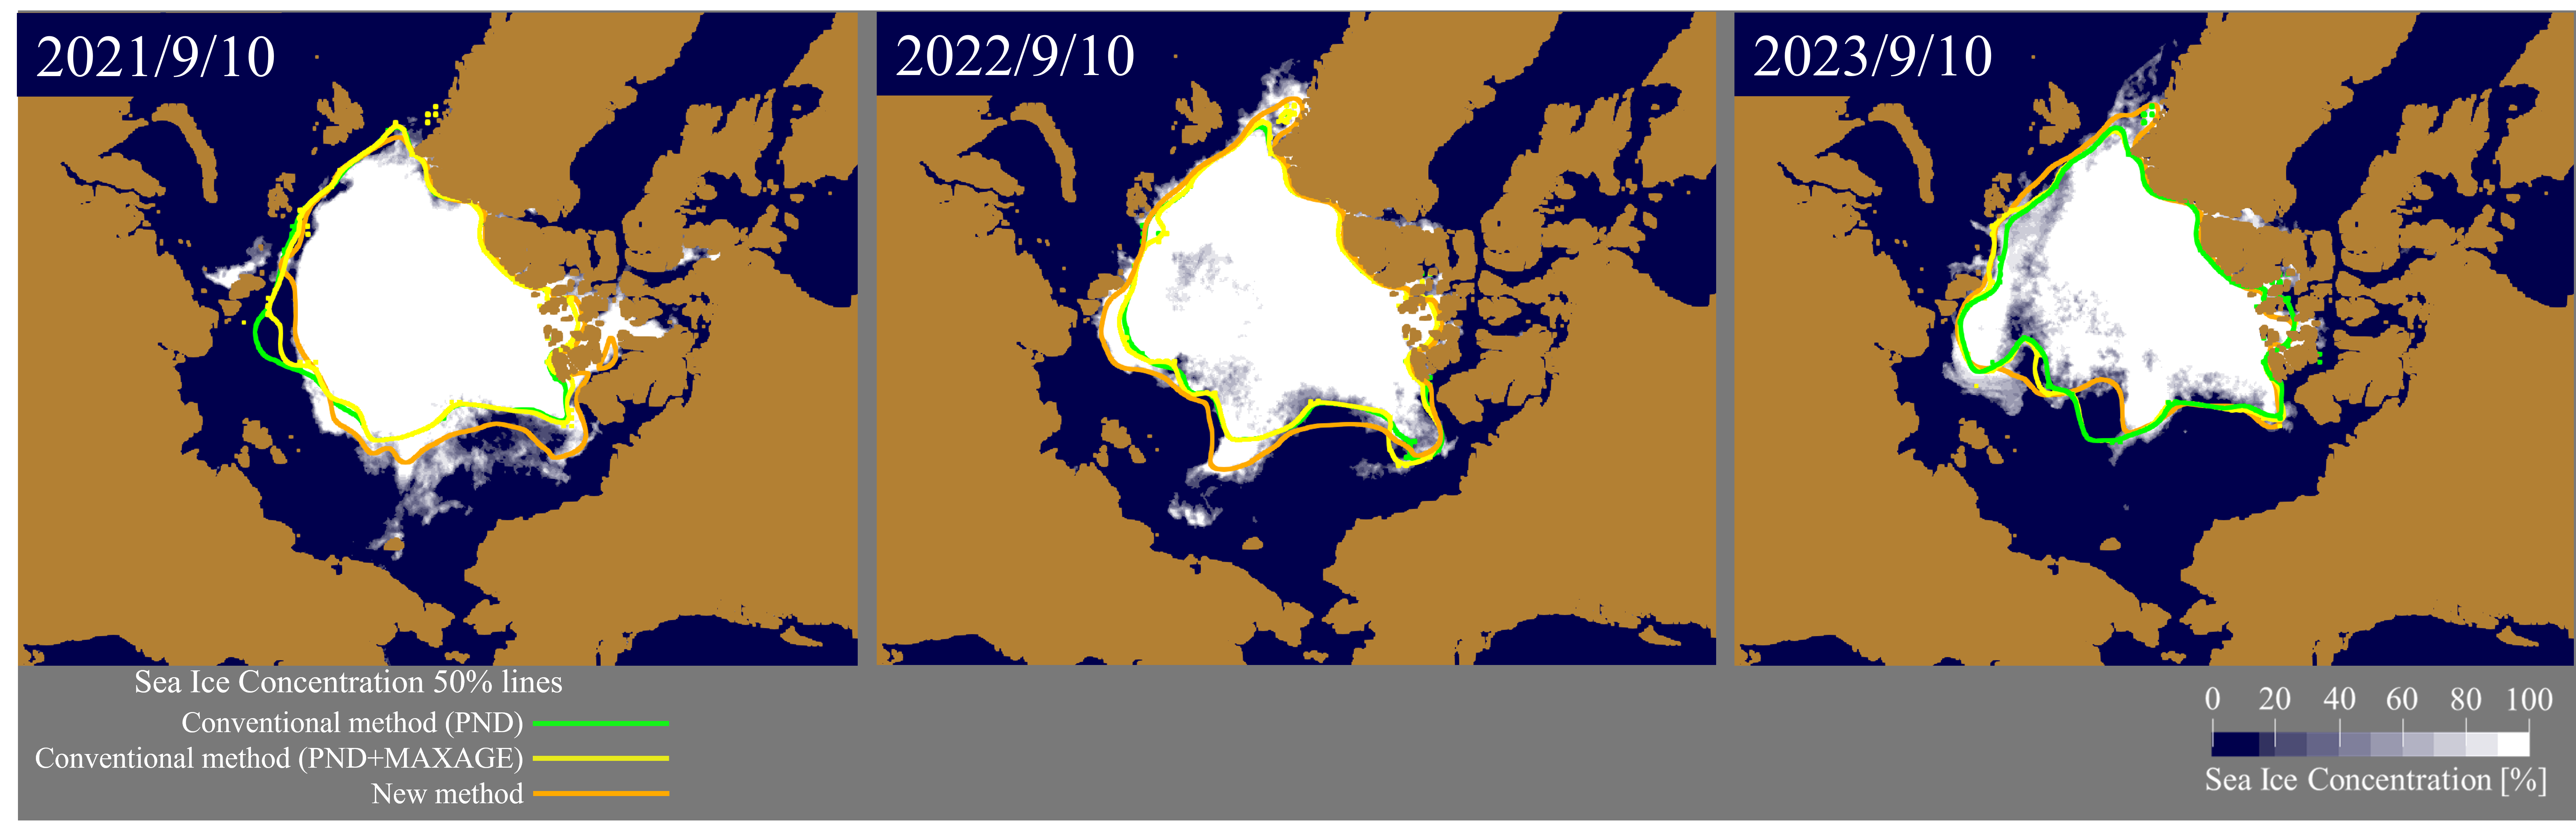
Figure 3 shows the results of the hindcast of sea ice concentration on September 10, 2021, 2022, and 2023. In this figure, the predictions by the new method explained here (orange line) and the conventional methods (green and yellow lines) are superimposed on satellite observations (AMSR2). The predicted lines indicate the 50% sea ice concentration. There are two types of conventional methods. The green line is based on a method that takes into account “sea ice movement from winter to spring,” and the yellow line is based on a method that takes into account “sea ice age” in addition to the green line. For the observed values, areas of sea ice concentration higher than 15% are shown in white.
The conventional methods show similar distribution; it overpredicts the Atlantic in 2021 and the East Siberian Sea in 2023 and underpredicts the East Siberian Sea in 2022 compared to observations.
On the other hand, the new method predicts sea ice extent well overall, although it underpredicts some areas compared to the observations. In particular, the new method improves the prediction accuracy in areas where the conventional methods overestimated the sea ice extent. Based on these results, we have adopted the new method in this year’s third report. The new method has enabled us to make more accurate predictions of sea ice extent.