

2020 First report
Atmosphere and Ocean Research Institute, The University of Tokyo
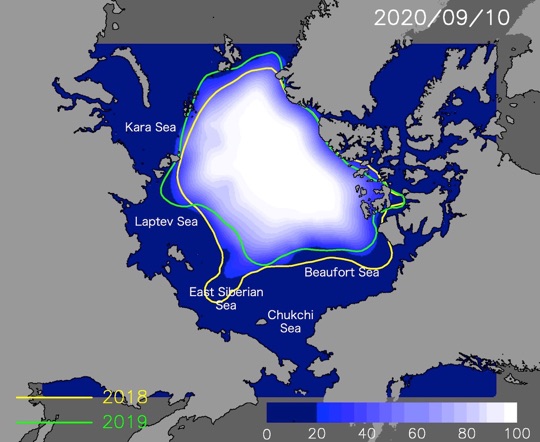
- Minimum ice extent will be about 4.51 million square kilometers.
- Sea routes of Russian side will open around August 1, and the Canadian side except for Canadian archipelago will open around July 11.
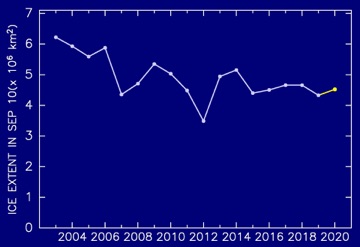
Sea ice extent on September 10 is expected to be 4.51 million square kilometers, which is 4% larger than the last year’s minimum area and 3% smaller than 2018’s minimum.
Ice cover in the Russian coastal side will retreat with nearly same speed as a normal year. Sea routes of the Russian side will open around August 1.
Ice retreat in the Beaufort Sea will be faster than a normal year. Sea routes of the Canadian side except for Canadian archipelago will open around the July 11, which is later than the last year.
Additionally, Figure 5 presents the age of sea ice on April 30 of 2018, 2019 and 2020. Area of old multiyear ice was reduced in the last year and the area is still small in this year. There is a possibility that a large-scale ice retreat will occur in this summer because most of the Arctic Ocean is covered by thin first-year ice.
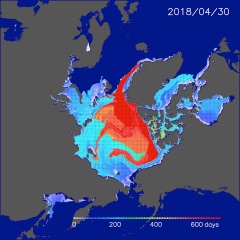
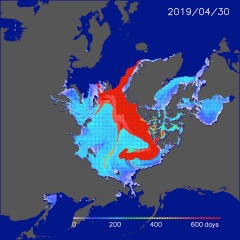
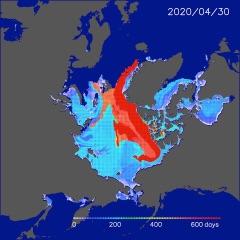
Multiyear ice area is small in 2019 and 2020.
For this prediction, we used the sea ice data from satellite microwave sensors AMSR-E and AMSR2, and the relationship between the winter ice motion and summer ice concentration (Kimura et al., 2013) In this report, we use the data until April 30. This forecast also consider the long-term trend of sea ice concentration.
Ice prediction map is also available in Arctic Data Archive Systemof National Institute of Polar Research.

If you have any questions about satellite monitoring of the Arctic Ocean, sea ice forecasting, or the forecasting methods used here, please contact the Sea Ice Information Center(sea_ice@nipr.ac.jp)

The sea ice forecast and its basic research were started in GRENE, continued to ArCS Project, and has been conducted in ArCS II Project since 2020.