

Arctic and Antarctic sea-ice information in January 2026
1. Arctic Sea Ice Conditions in January 2026
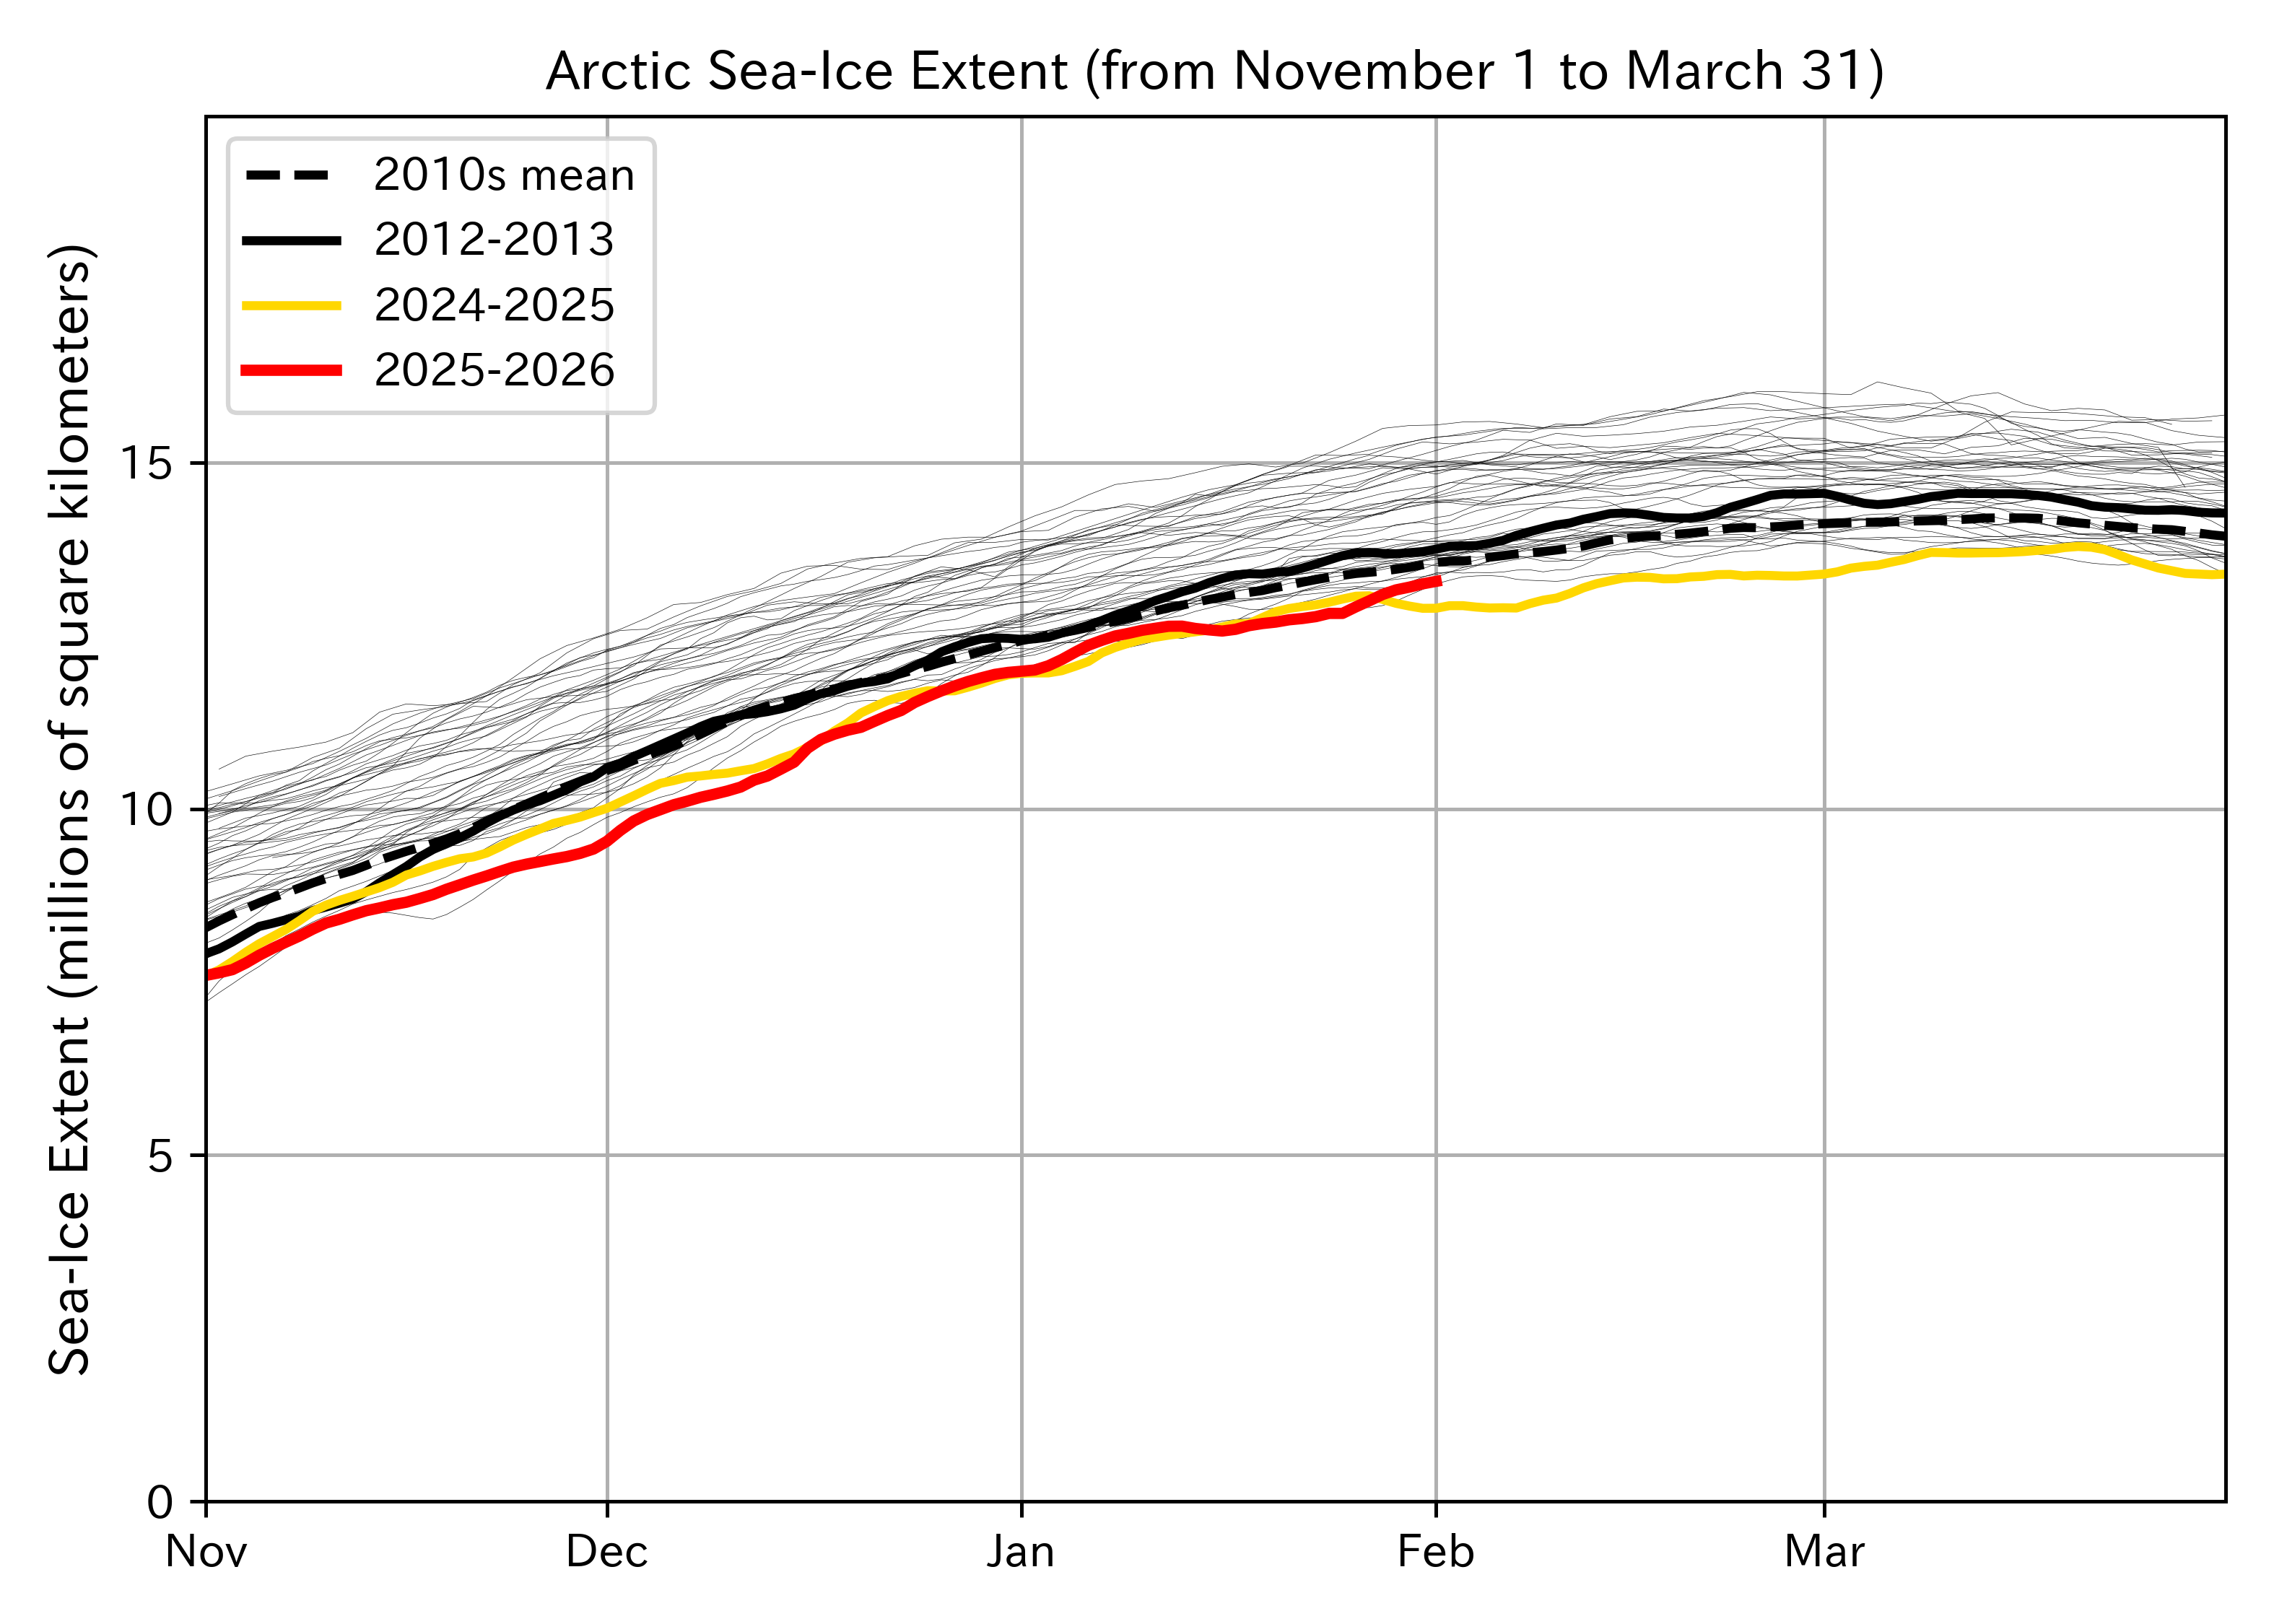
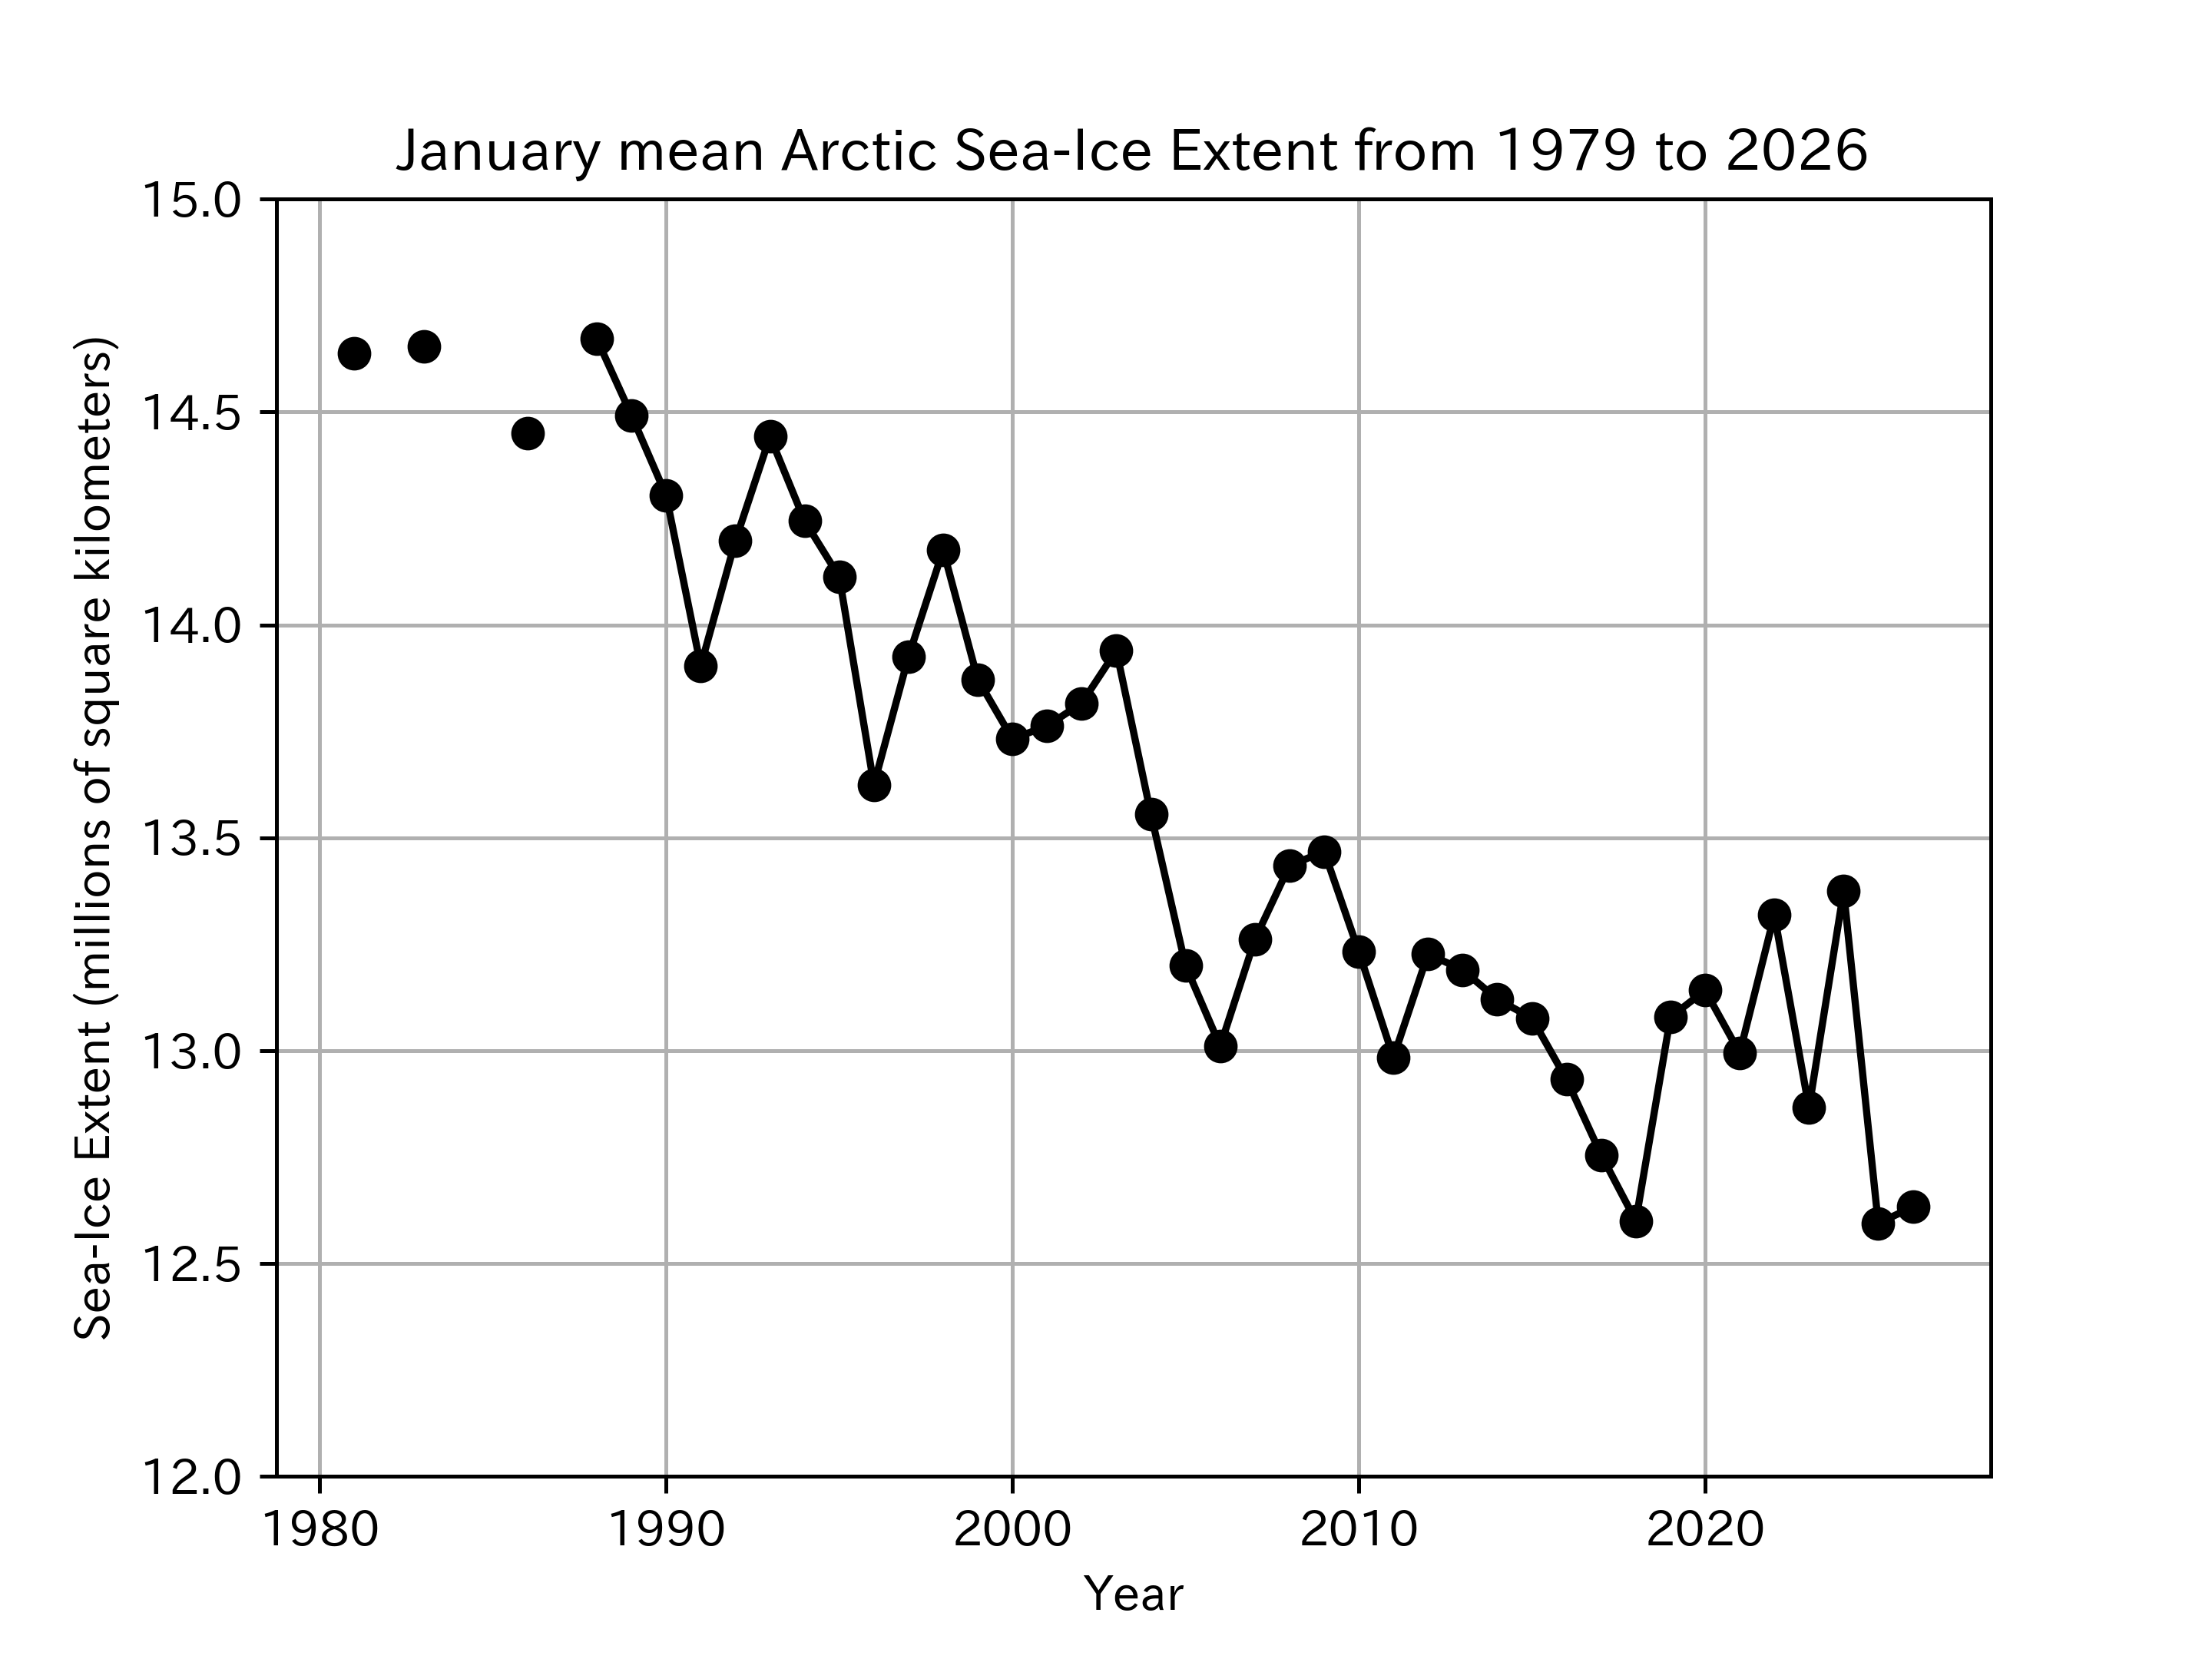
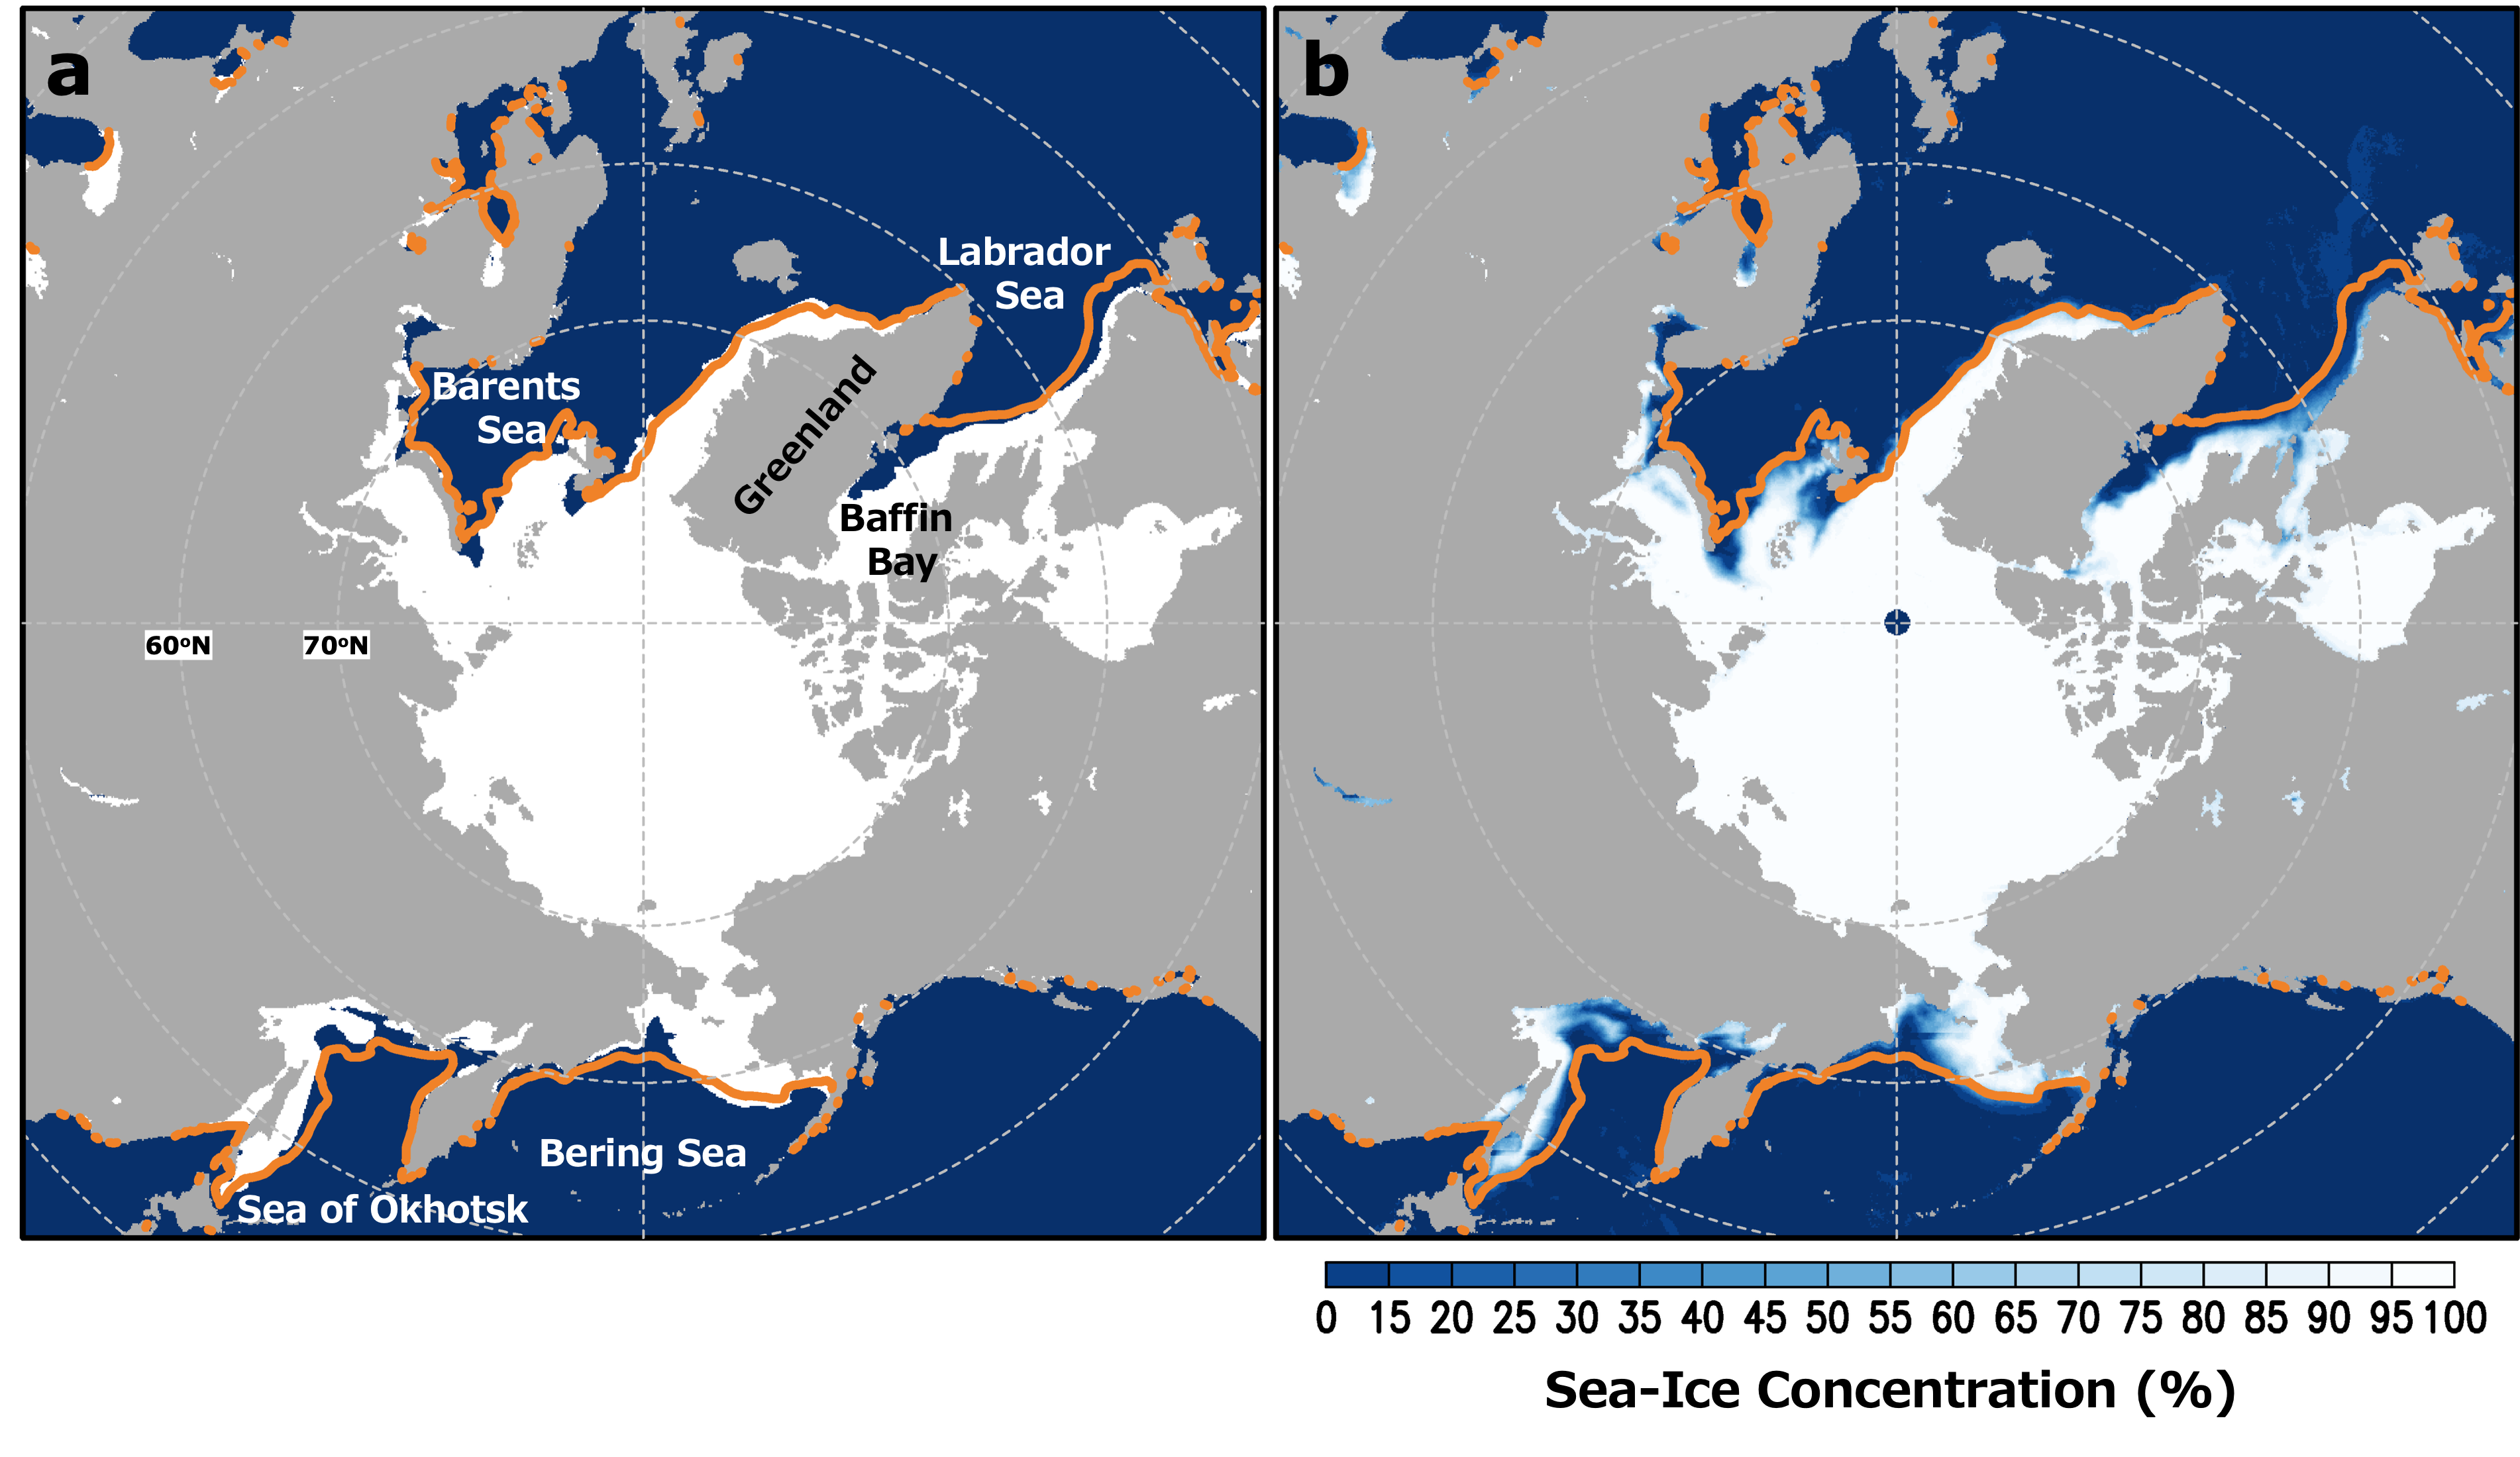
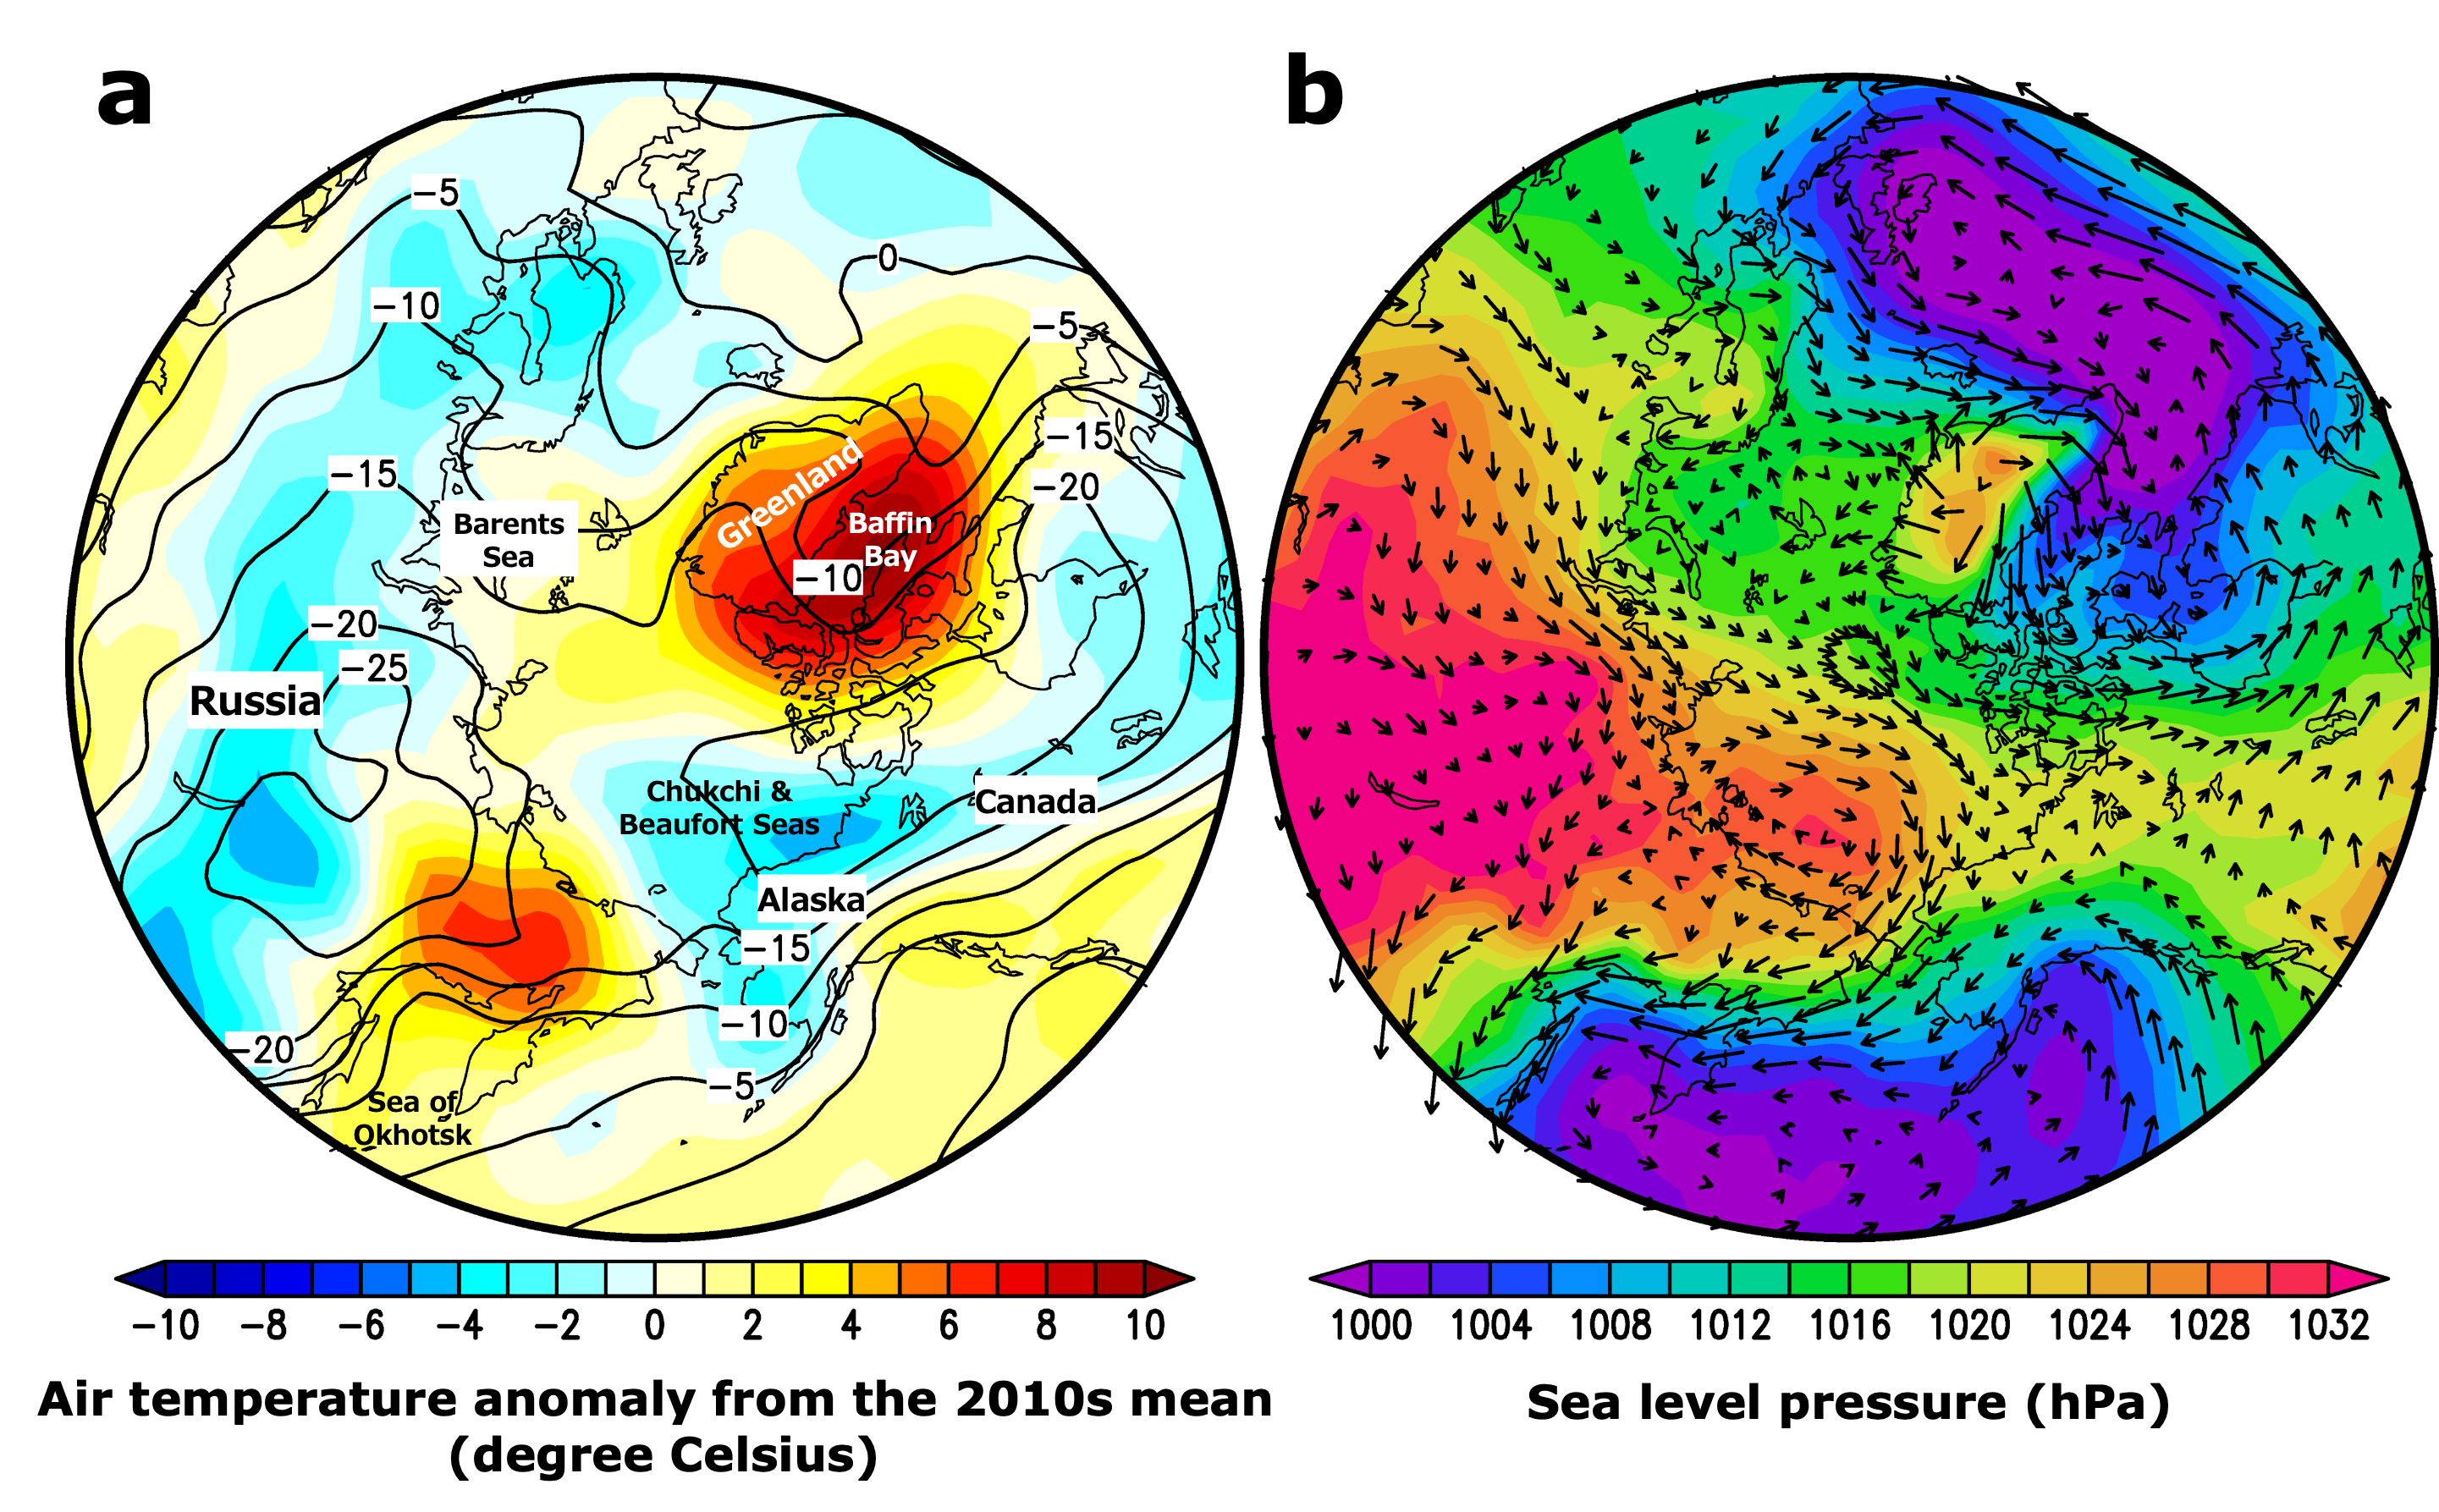
In January 2026, daily Arctic sea-ice extent (note 1) remained above the 2025 record low in early January, reached a minimum in mid-month, and then increased toward the end of the month (Figure 1). However, overall conditions remained persistently low. As a result, Arctic sea-ice extent in January 2026 averaged 12.63 million square kilometers, the third-lowest in the 48-year satellite record since 1979 (Figure 2). The sea-ice extent remained low in the Barents Sea and the Baffin Bay–Labrador Sea regions, particularly off the west coast of Greenland, where large open-water areas are found (Figure 3). Lower ice concentration was also found in the Sea of Okhotsk and the western Bering Sea. These conditions were partly associated with unusually warm atmospheric patterns (Figure 4). Air temperatures over the Baffin Bay region were 4–10°C above average, accompanied by warm southeasterly winds. Similar warm conditions (2–4°C) and inshore winds were observed over the Sea of Okhotsk. By contrast, colder-than-average temperatures persisted over parts of the Chukchi–Beaufort regions, northern Canada, and inland Russia.
2. Antarctic Sea Ice Conditions in January 2026
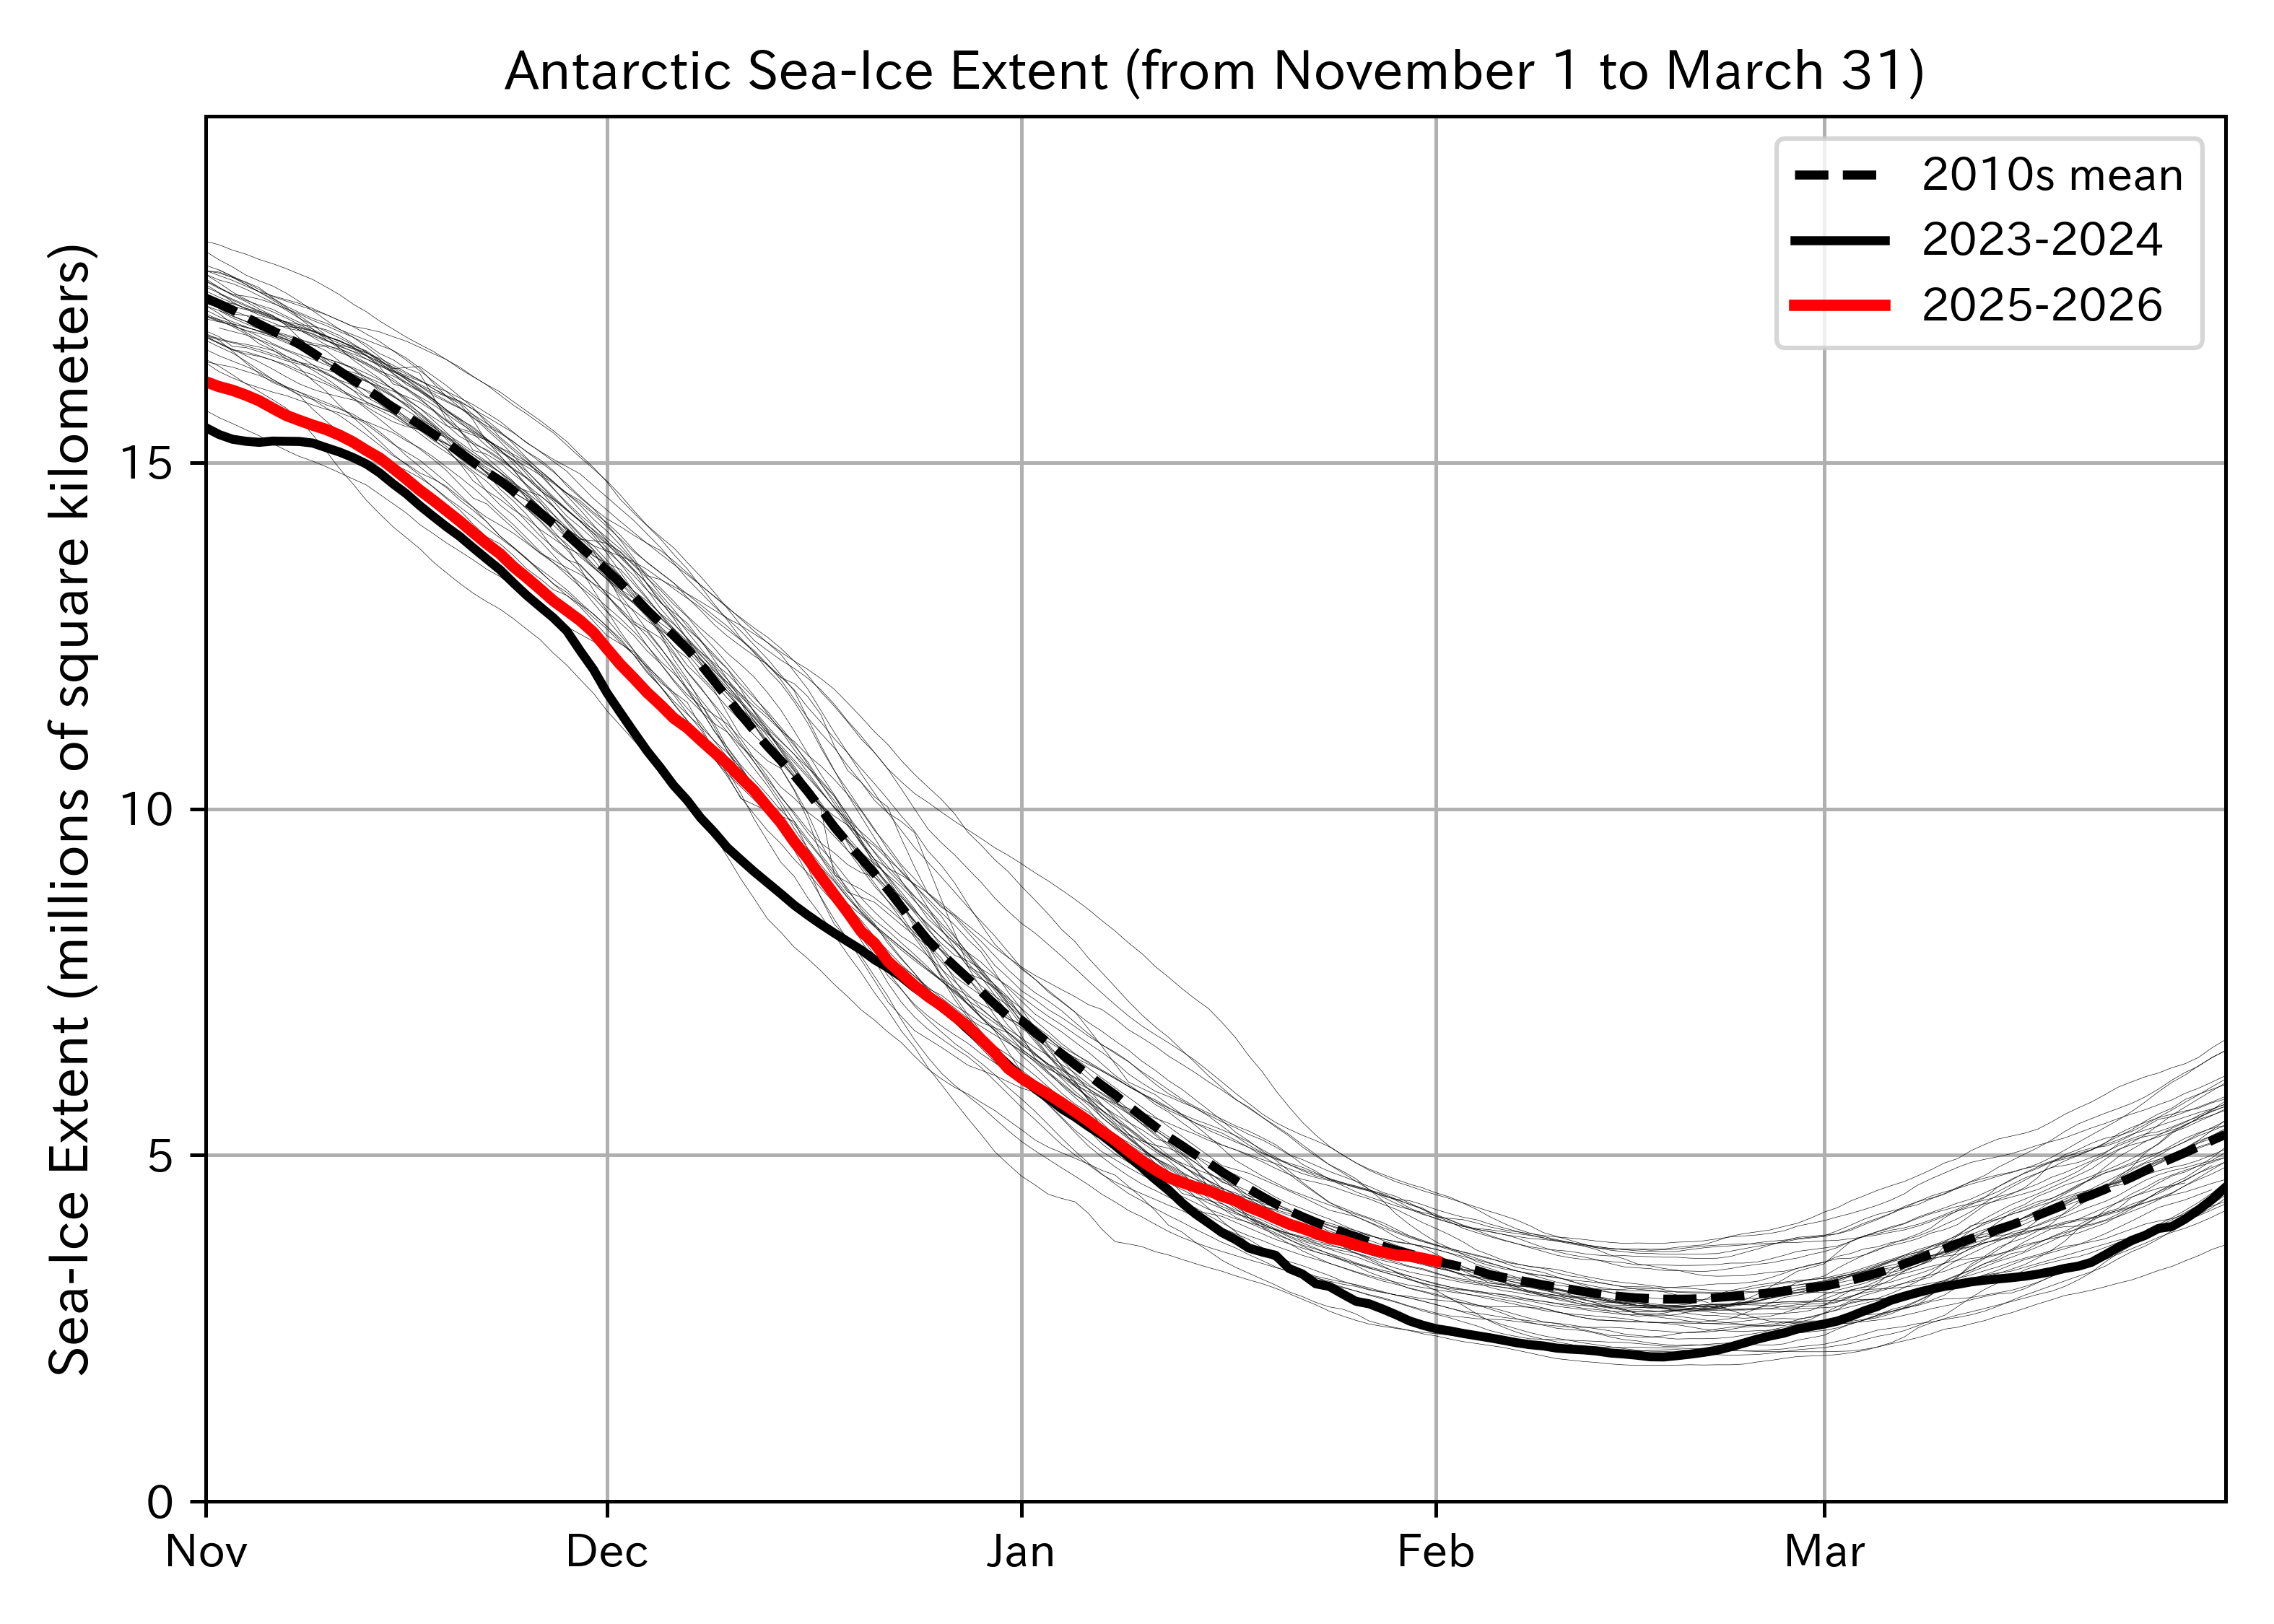
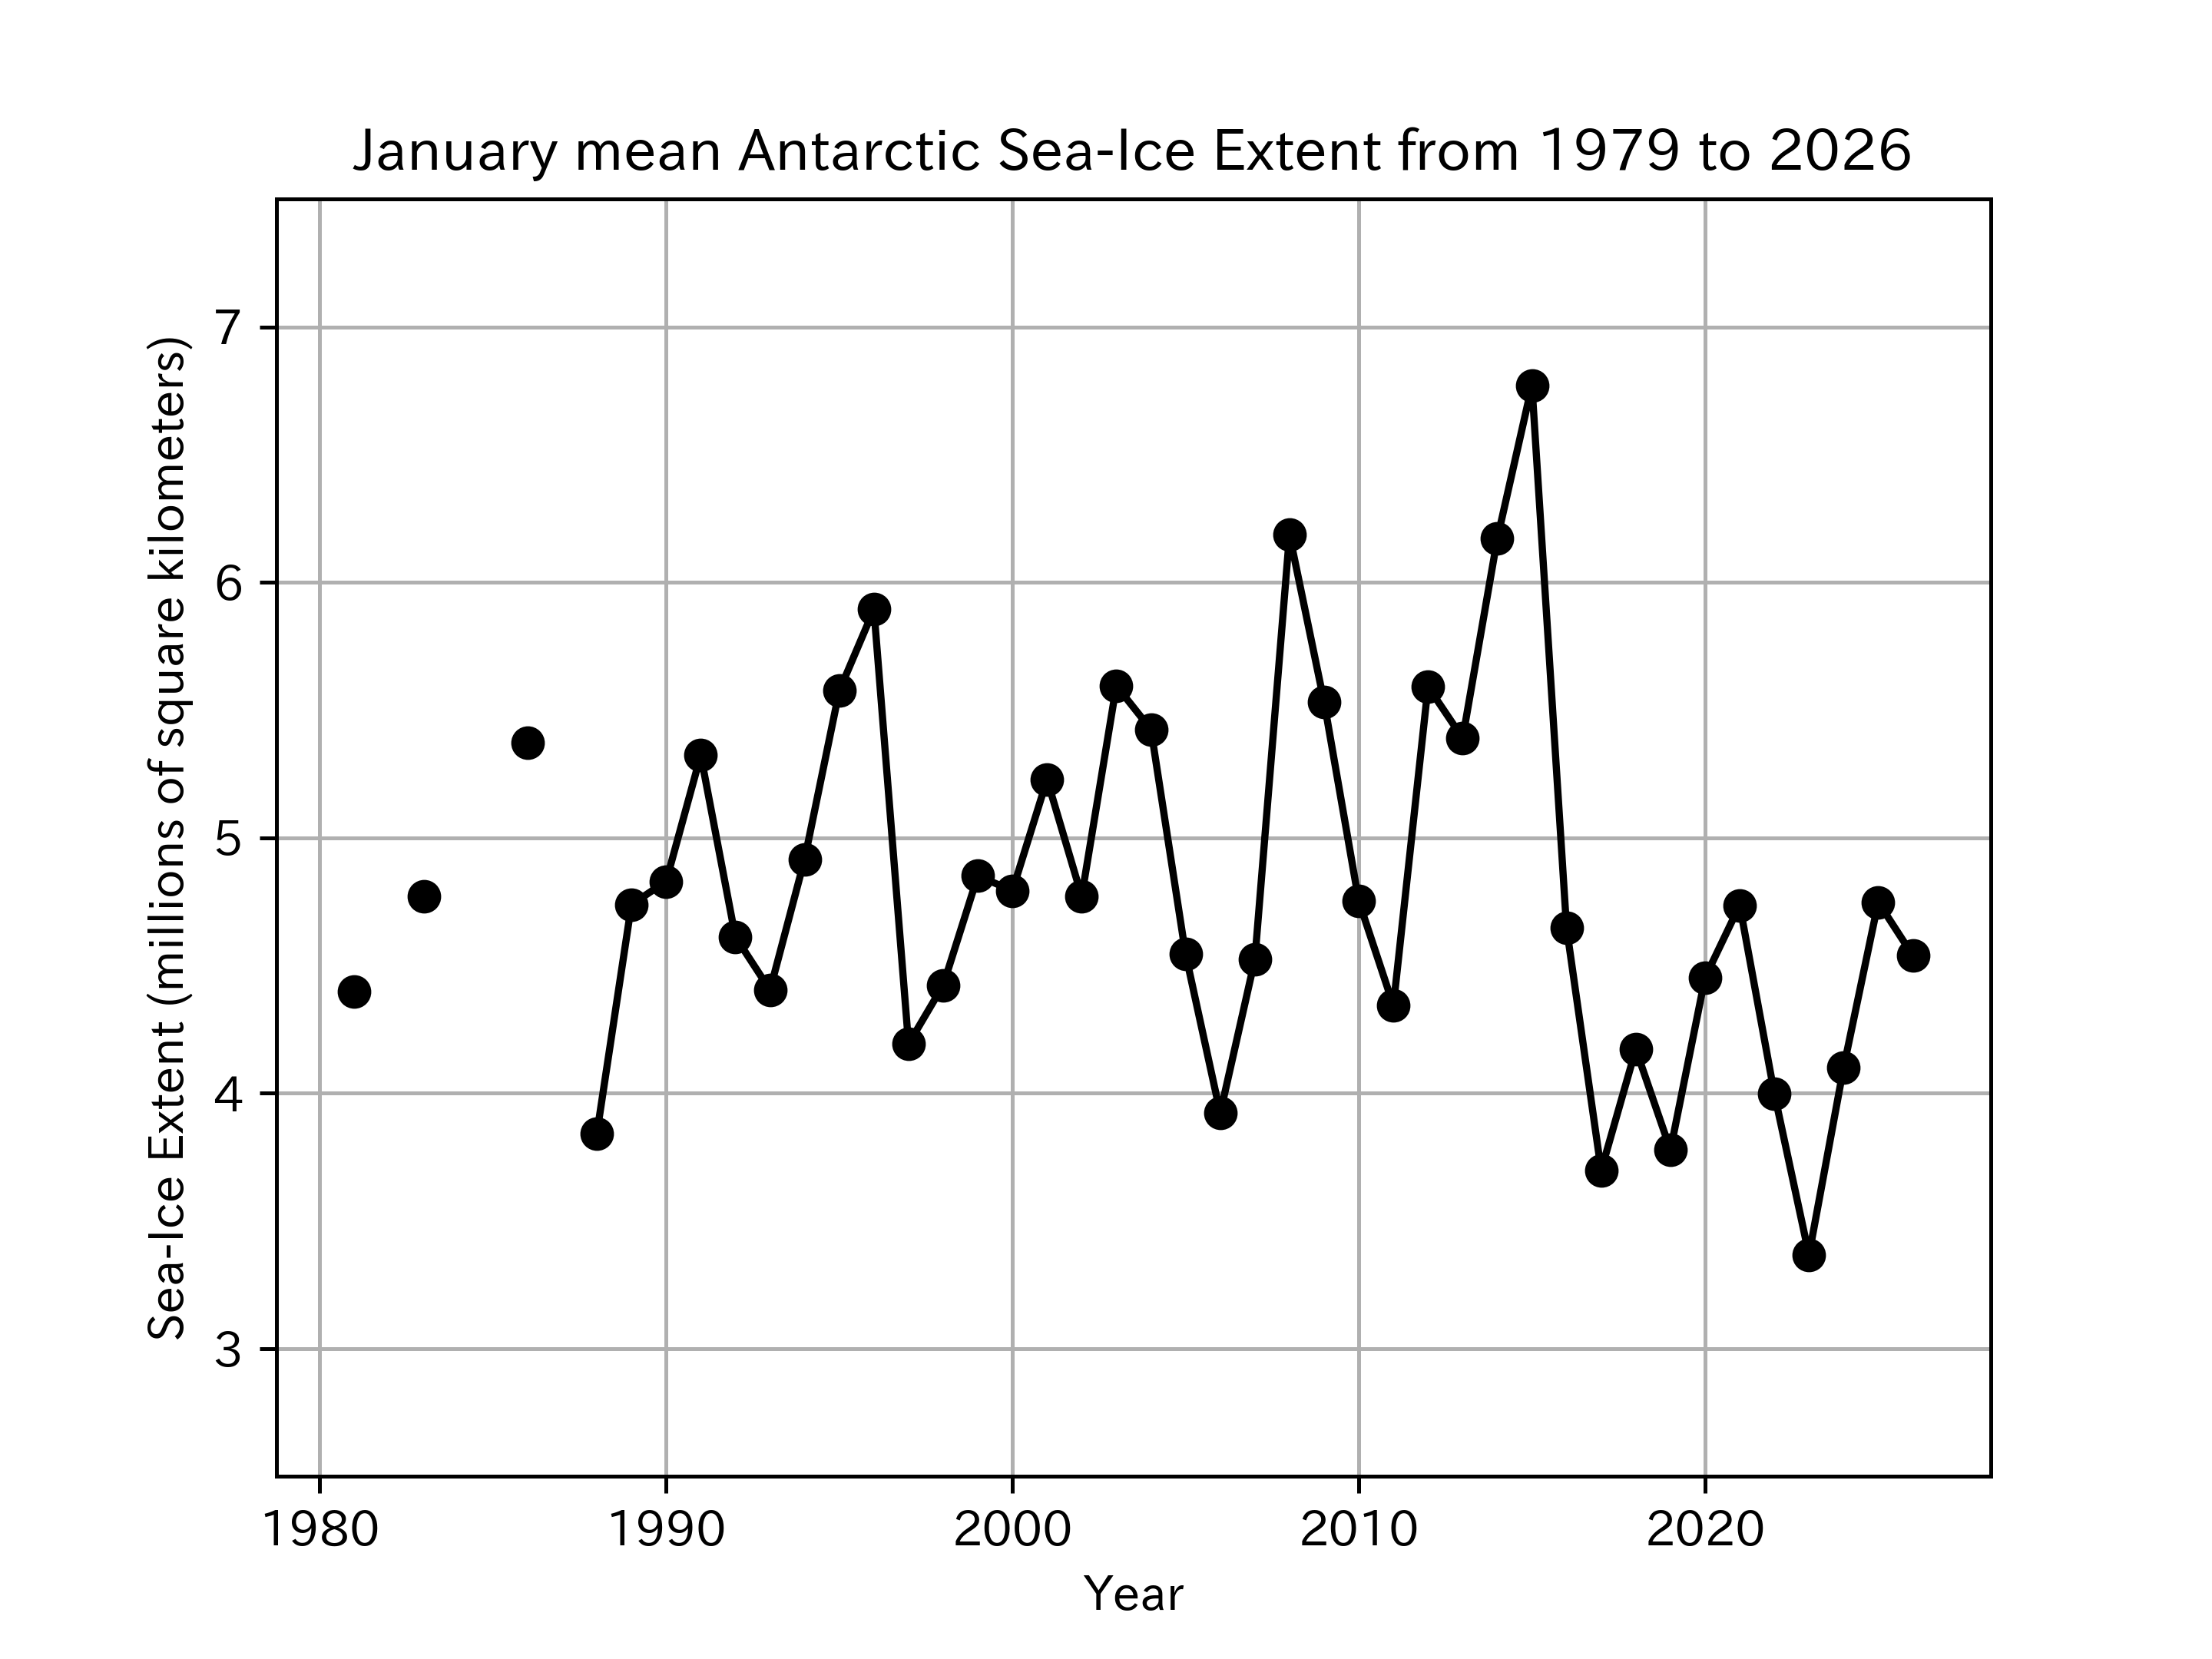
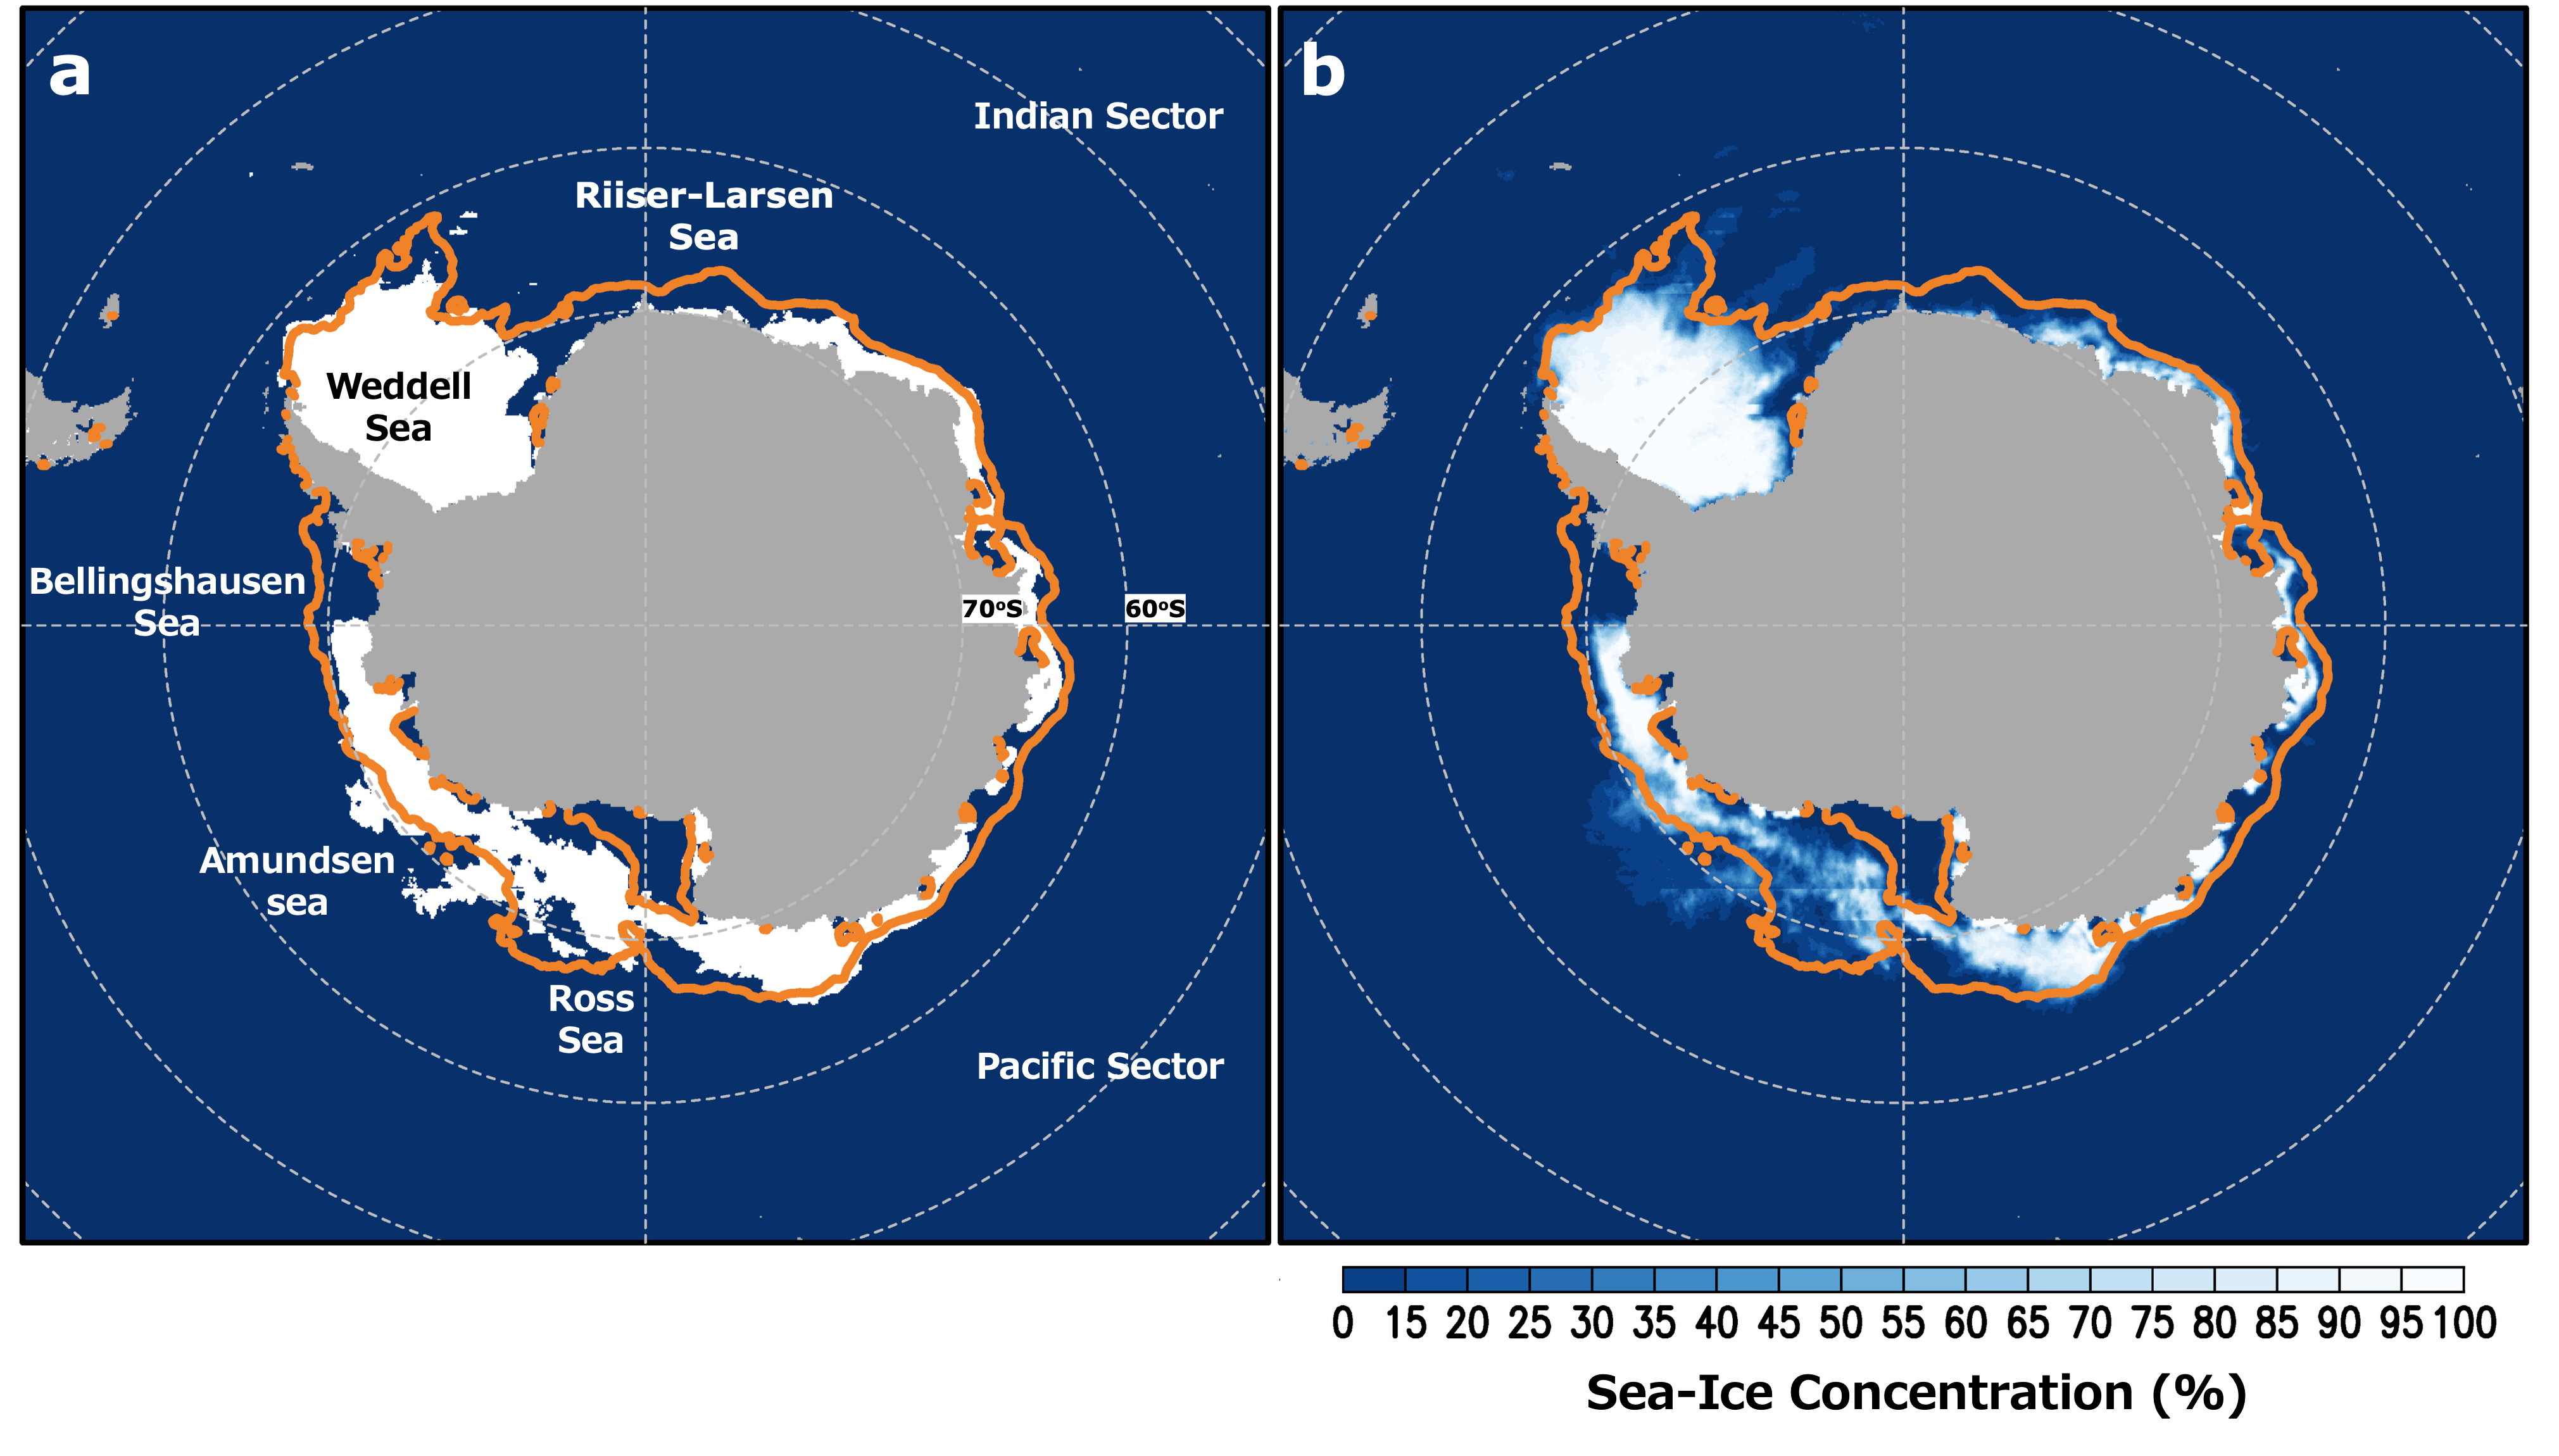
In January 2026, daily Antarctic sea-ice extent decreased steadily until early January, but after that, the rate of decline slowed and approached the 2010s mean (Figure 5). As a result, Antarctic sea-ice extent in January 2026 averaged 4.53 million square kilometers, which remained relatively high compared with recent years. This record is the 16th-lowest in the 48-year satellite record since 1979 (Figure 6). Rapid sea-ice loss was particularly apparent in the Riiser-Larsen Sea (Figure 7), likely due to low sea-ice concentration in the previous month (note 3). Similar vulnerable conditions were also observed between the Ross and Amundsen Seas, suggesting the potential for accelerated melting under favorable weather conditions. In contrast, the Weddell Sea still has near-average sea-ice coverage and high ice concentration, which may have contributed to the slowdown in overall Antarctic sea-ice retreat.
1: Sea-ice extent
For details on the calculation method of sea-ice extent, please refer to ADS . In this article, we used a five-day average.
2: NCEP-NCAR Reanalysis 1 (https://psl.noaa.gov/data/gridded/data.ncep.reanalysis.html) from Kalnay et al., The NCEP/NCAR 40-year reanalysis project, Bull. Amer. Meteor. Soc., 77, 437-470, 1996
3: Please refer to Arctic and Antarctic sea-ice information in December 2025 (in Japanese).