

2016 First report
Atmosphere and Ocean Research Institute, The University of Tokyo
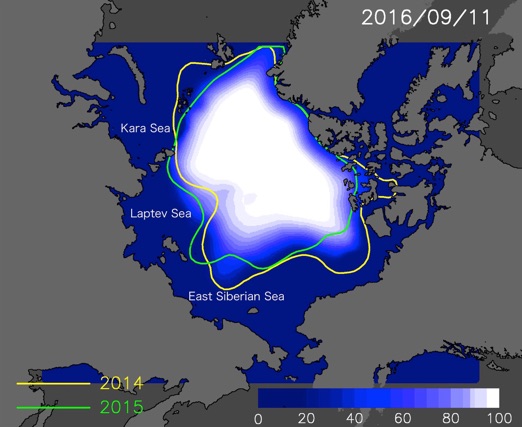
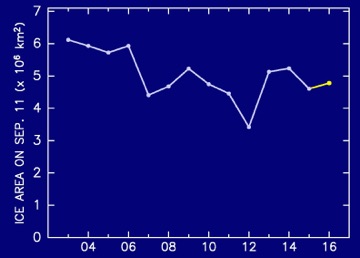
- The minimum extent in September will be about 4.8 million square kilometer, which is a little larger than the last year.
- The sea routes of Russian side and Canadian side will both open.
The Russian side will open around August 25, and the Canadian side except for Canadian archipelago will open around July 14.
On the Russian side, sea ice in the Laptev Sea is expected to be thin and retreat quickly. On the other hand, sea ice in the East Siberian Sea is likely to retreat slowly. The ice retreat in the East Siberian Sea will be late compared with the last year because the area is covered by thicker ice piled up by the winter convergence of sea ice. The sea routes of the Russian side will open around the August 25, which is nearly equal to the last year.
On the Canadian side, sea ice in summer is expected to be thin and retreat more quickly than the last year. The sea routes of the Canadian side except for Canadian archipelago will open around the July 14.
Overall, the whole Arctic sea ice extent will retreat a little slowly than last year. Sea ice extent on the September 11, which is the minimal area phase of Arctic sea ice, is expected to be about 4.8 million square kilometer.
Prediction map is also available in Arctic Data Archive System of National Institute of Polar Research.
Method of Prediction : Tracking sea ice from winter to spring
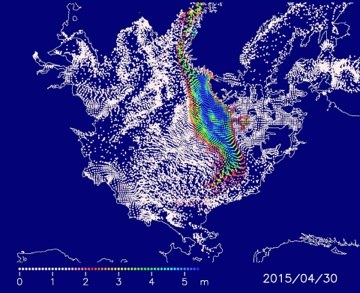
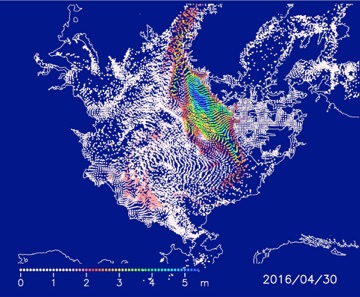
We predicted the Arctic sea ice from coming July 1 to November 1, based on the movement of sea ice from last December to April (Figure 4) in the same way as last year.
We used the data from satellite microwave sensors, AMSR-E (2002/03-2010/11) and AMSR2 (2012/13-2015/16).
The data analysis method is based on our recent research (Kimura et al., 2013). First, we expect the distribution of the sea ice thickness in spring from the movement of sea ice during winter through spring. Then, we predict the summer ice area depending on the assumption that thick ice remains later and thin ice melts sooner than the average.
To begin with, we explain how to calculate the movement of the sea ice. We distributed particles homogeneously over the Arctic sea ice on December 1. We traced the trajectories of the particles to the end of April by using the satellite derived daily ice velocity. Based on the relationship between particle concentration on April 30 and ice concentration in summer, we can predict the summer ice area from the particle concentration in April of this year.
In addition, we take it into account that thickness of sea ice on the 1st of December calculated by the method of Krishfield et al. (2014) .
It is defined as “virtual volume” that the sum of thickness data of all the particles in 240 kilometer radius. We predict summer ice concentration by this virtual volume.
References
Kimura, N., A. Nishimura, Y. Tanaka and H. Yamaguchi, Influence of winter sea ice motion on summer ice cover in the Arctic, Polar Research, 32, 20193, 2013.
Krishfield, R. A., Proshutinsky, A., Tateyama, K., Williams, W. J., Carmack, E. C., McLaughlin, F. A., and Timmermans, M. L., Deterioration of perennial sea ice in the Beaufort Gyre from 2003 to 2012 and its impact on the oceanic freshwater cycle, J. Geophys. Res., 119, 1271-1305, doi:10.1002/2013JC008999, 2014.

If you have any questions about satellite monitoring of the Arctic Ocean, sea ice forecasting, or the forecasting methods used here, please contact the Sea Ice Information Center(sea_ice@nipr.ac.jp)
The research for this forecast method was started in GRENE Project. The sea ice forecast was conducted in ArCS Project (FY2015-2019).