

2025 Third report
Noriaki KIMURA (Atmosphere and Ocean Research Institute, The University of Tokyo) , Arctic Sea Ice Information Center
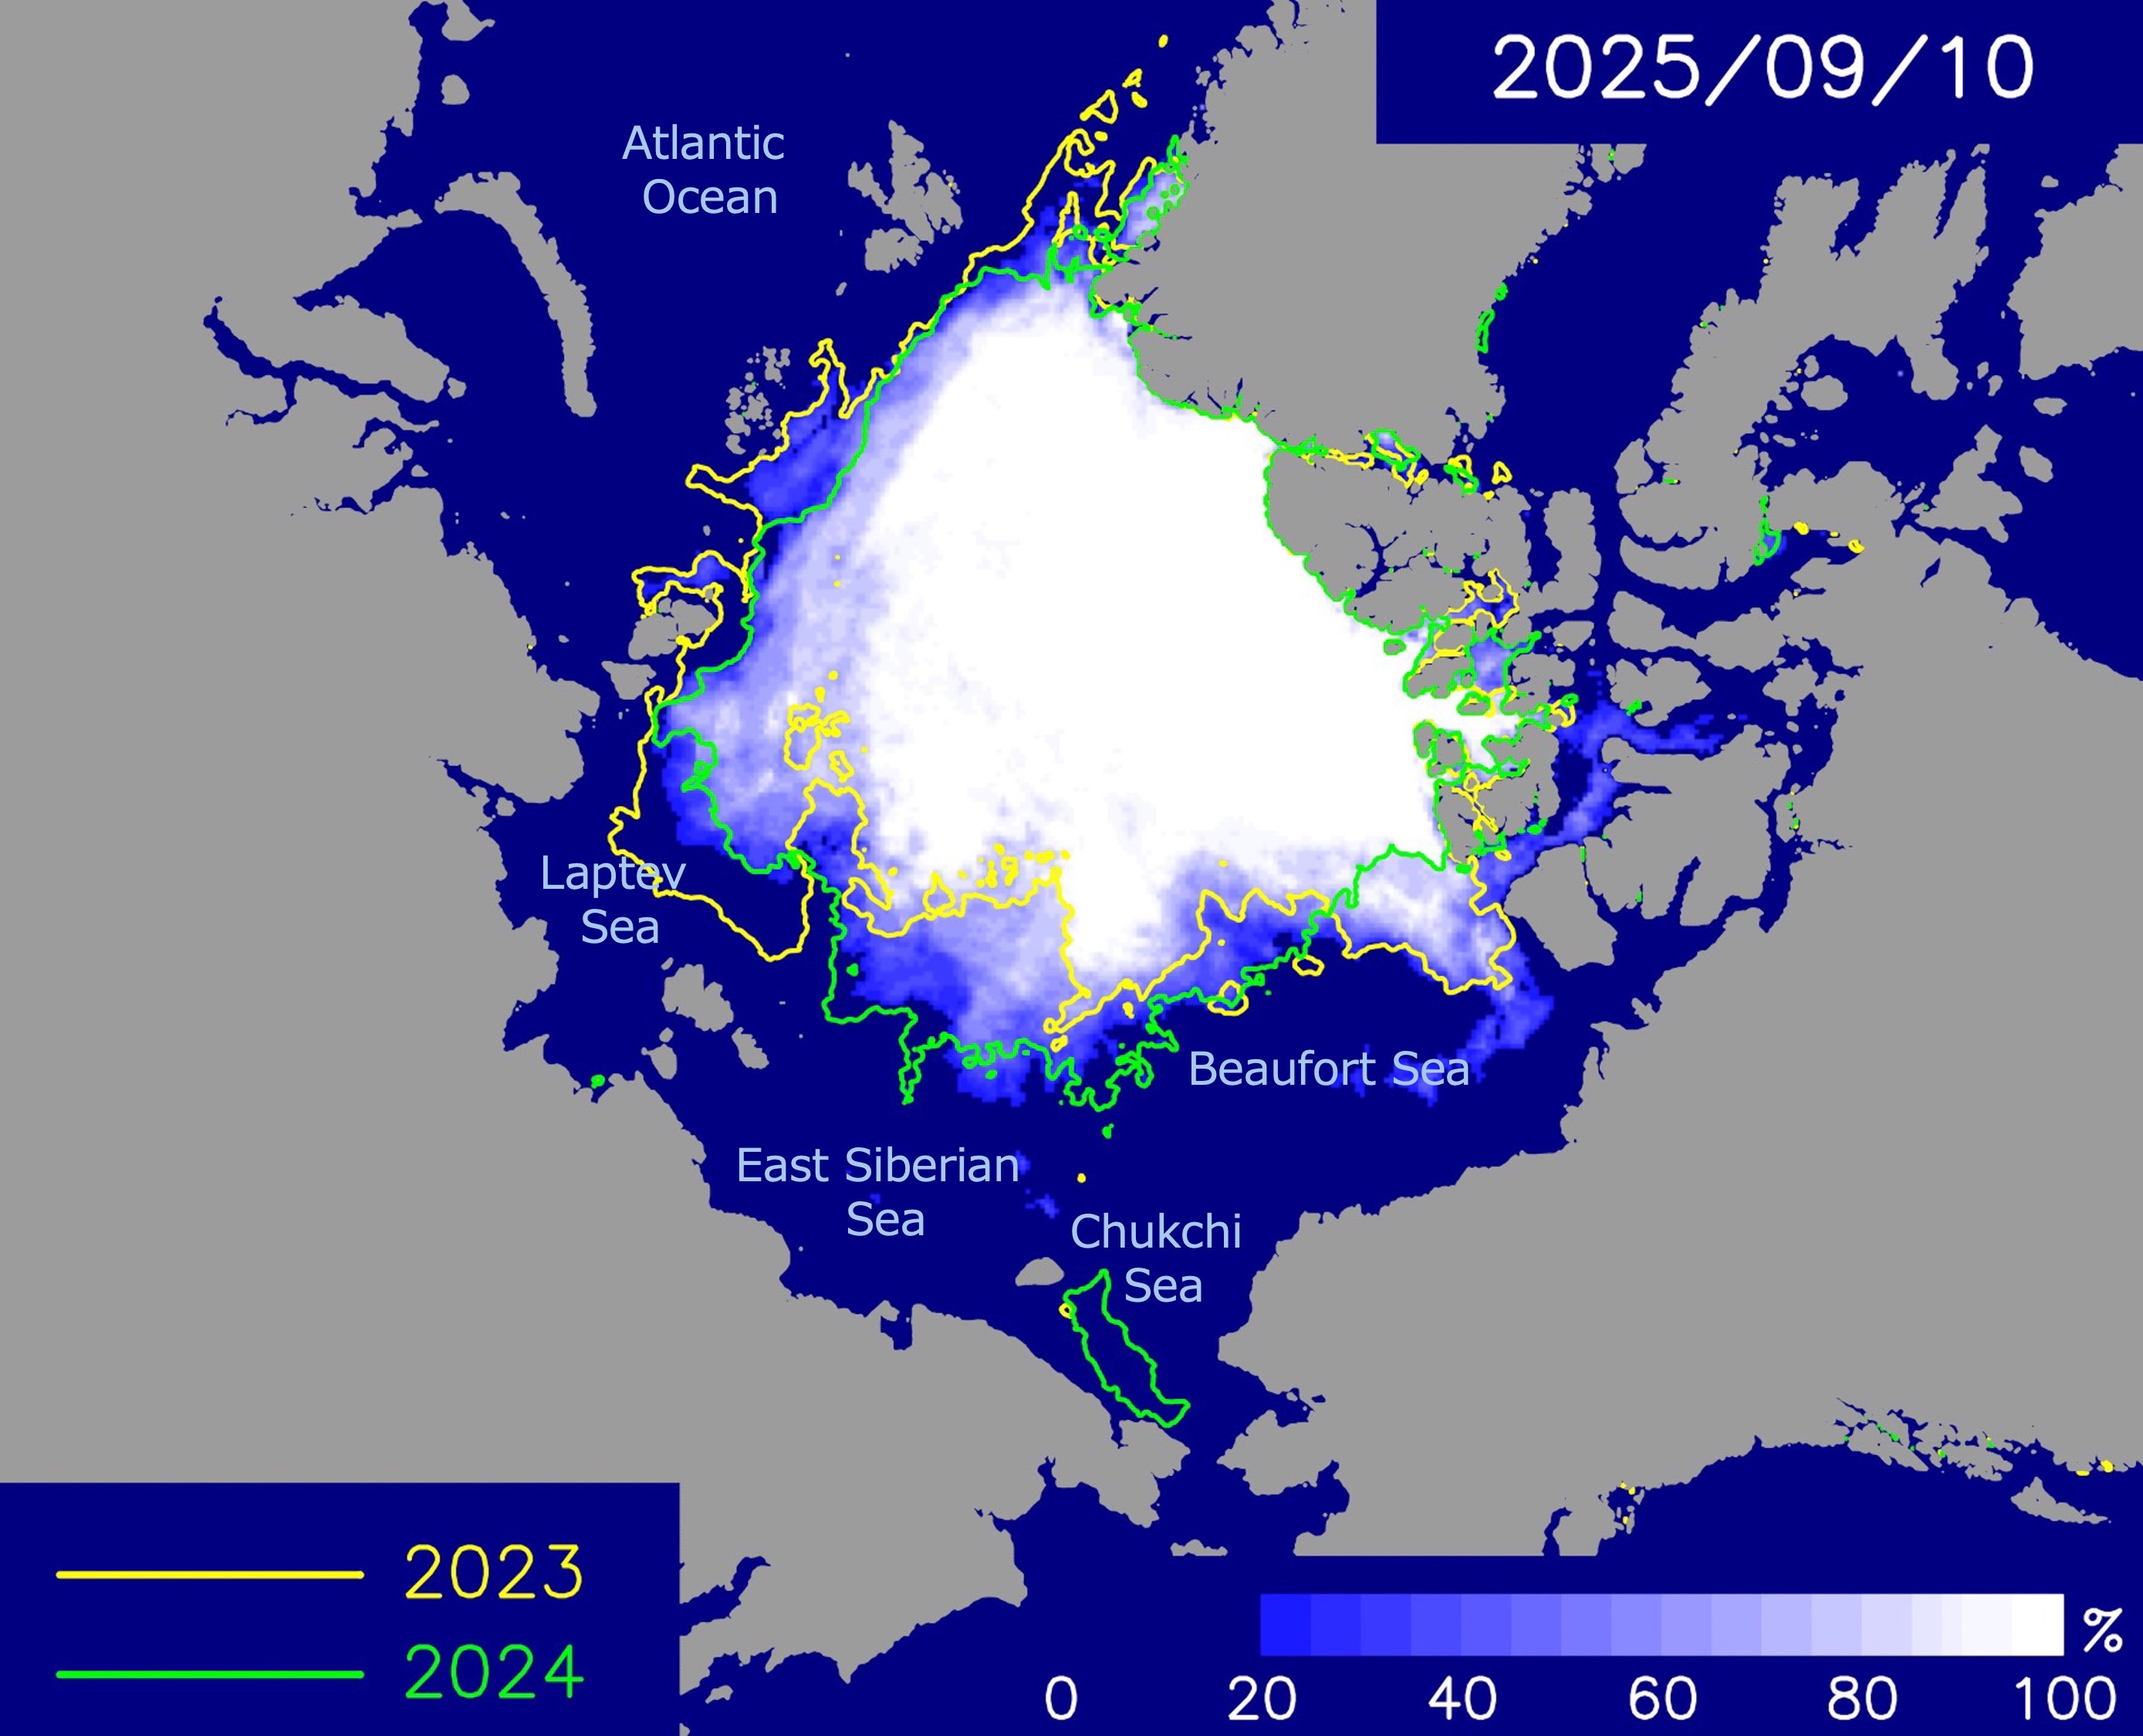
- The Arctic sea-ice extent is expected to shrink to 4.42 million square kilometers in mid September.
- The Northern Sea Route along the Russian coast is likely to open in late August, and the route along the Canadian coast (excluding the archipelago) is expected to open in late July.
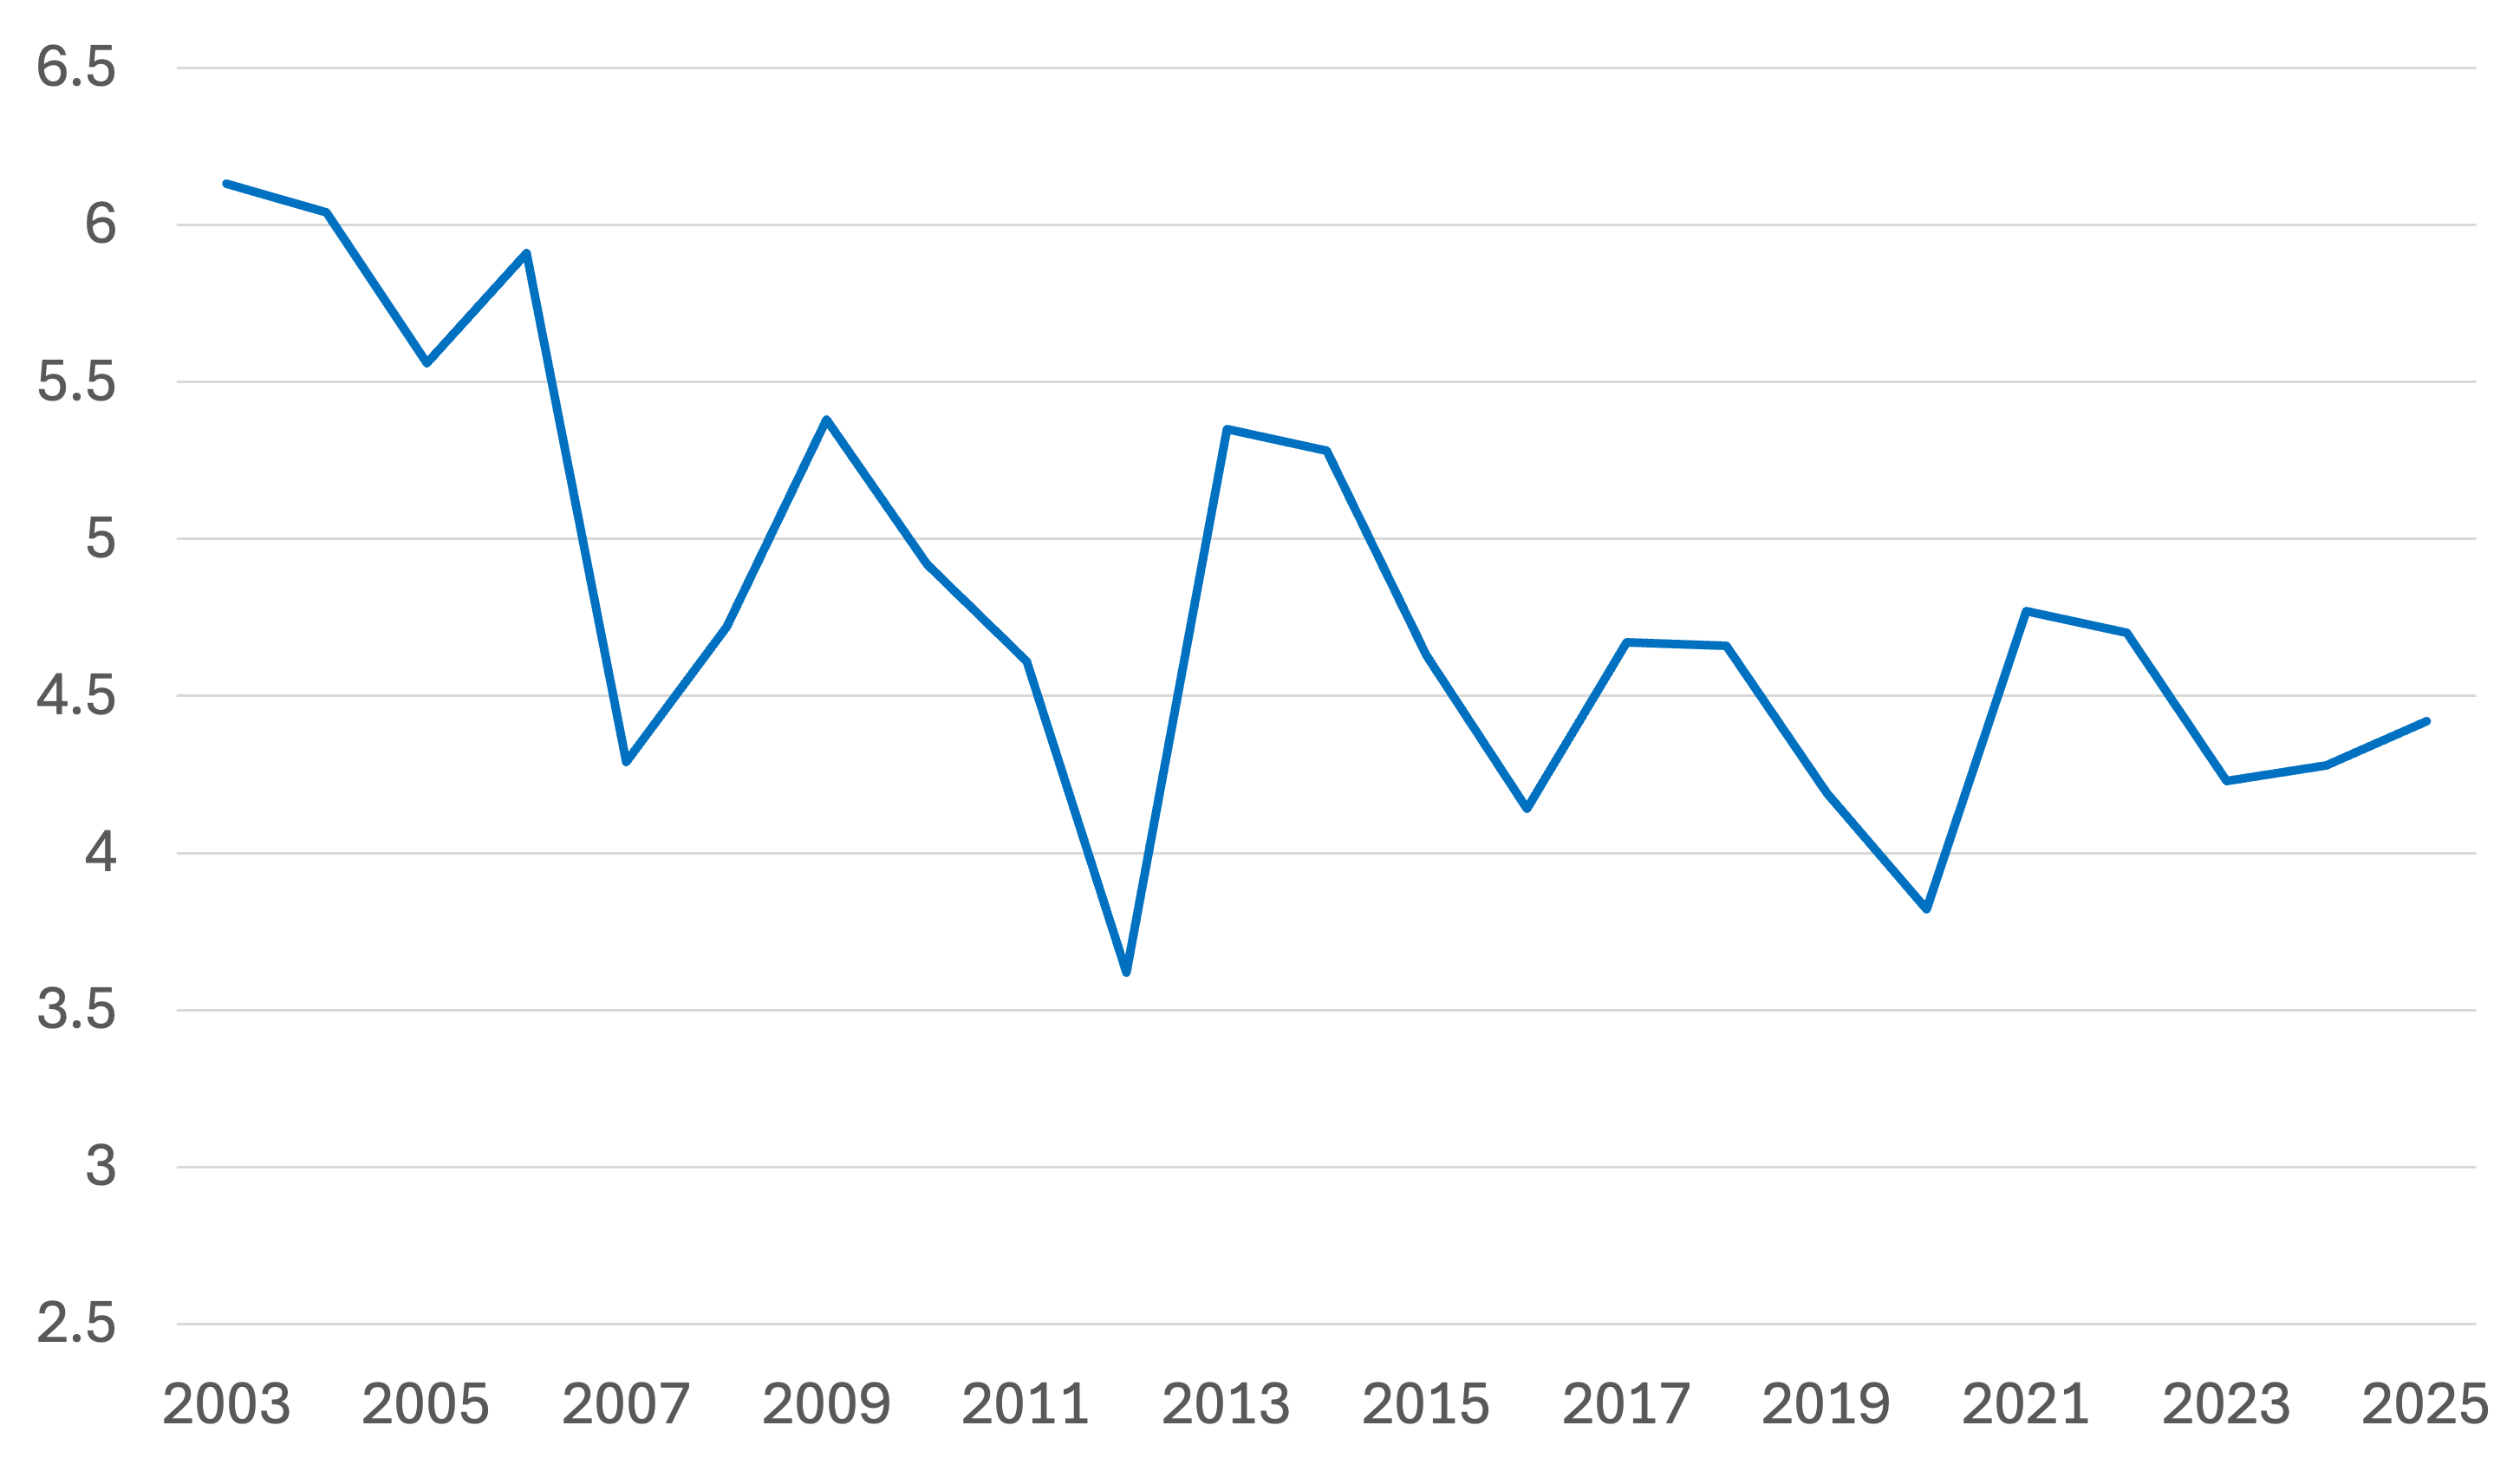

The Arctic sea-ice extent is projected to decrease to around 4.42 million square kilometers at its annual minimum on September 11. This value is slightly larger than the minimums observed in 2023 and 2024.
Along the Russian coast, the Northern Sea Route is expected to open in late August. On the Canadian side, excluding the archipelago, the sea ice is projected to retreat from the coast by late July, allowing navigation.
The sea ice distribution in this forecast was calculated based on sea ice thickness observed at the end of June. Using observational data from 2007 to 2024, we analyzed the relationship between sea ice thickness on June 30 and sea ice concentration from August onward. The analysis revealed that areas with thicker ice at the end of June tend to retain more ice through the summer months. Based on this relationship, we predicted sea ice concentration from August 1 onward using the sea ice thickness observed on June 30, 2025.
The ice thickness used in the prediction were derived from data by the satellite-borne microwave radiometers AMSR-E and AMSR2. A scientific paper describing the method is currently under review and is available online at the following site: https://egusphere.copernicus.org/preprints/2025/egusphere-2025-3286/. The ice thickness data will be made available via the Arctic Data archive System (ADS) of the National Institute of Polar Research.
Current sea ice conditions
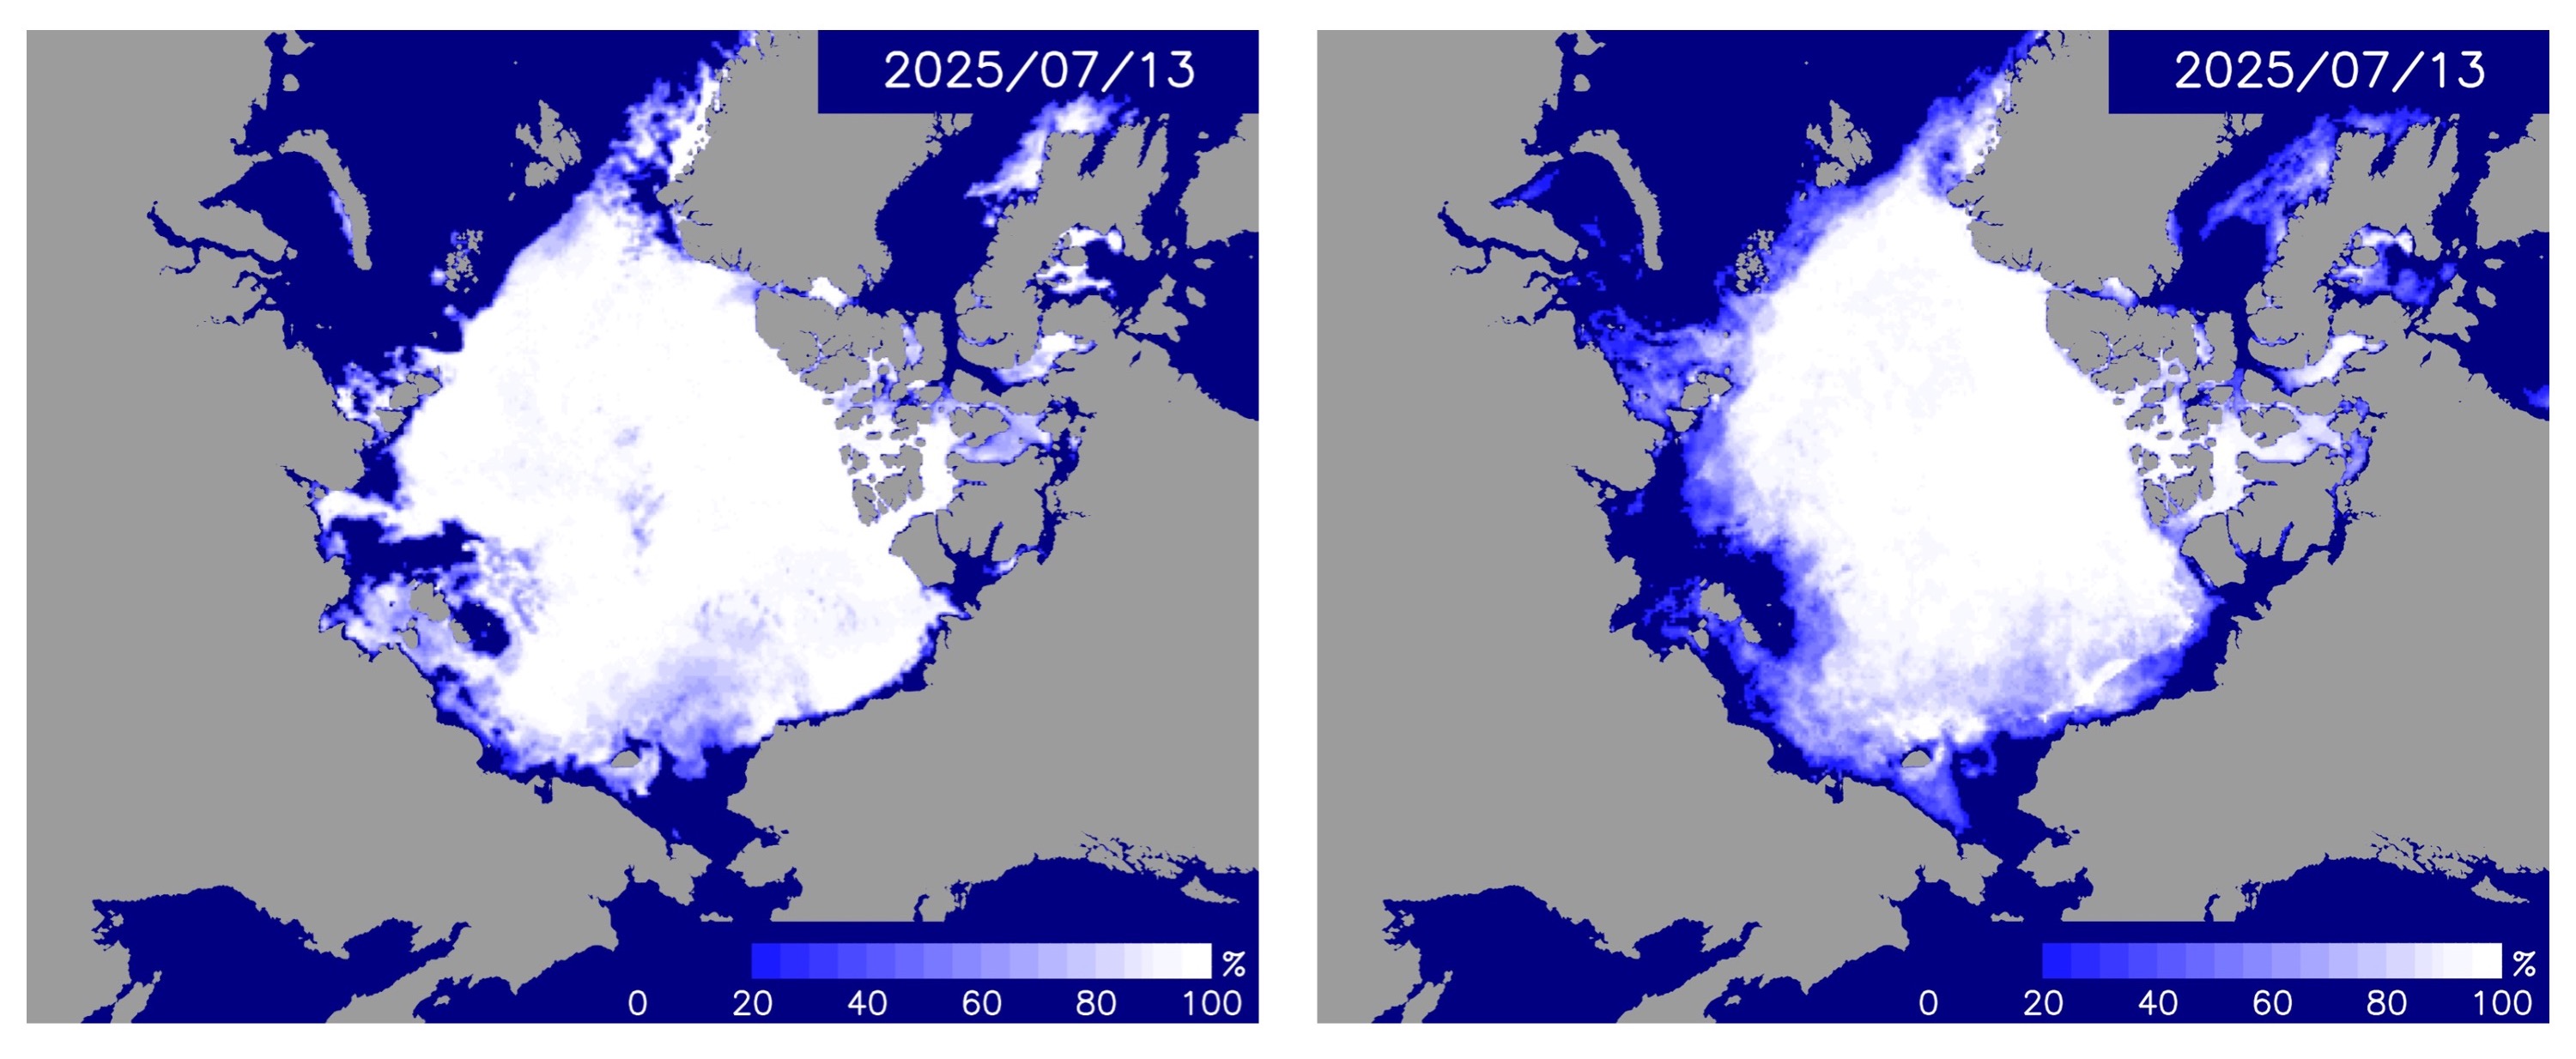
Sea ice in the Arctic Ocean has begun to retreat rapidly. Figure 5 shows the sea ice cover on July 13, with the left panel representing the observed distribution and the right panel showing the forecast from the Second Report. Overall, the retreat of the ice is progressing at a slightly slower pace than predicted.
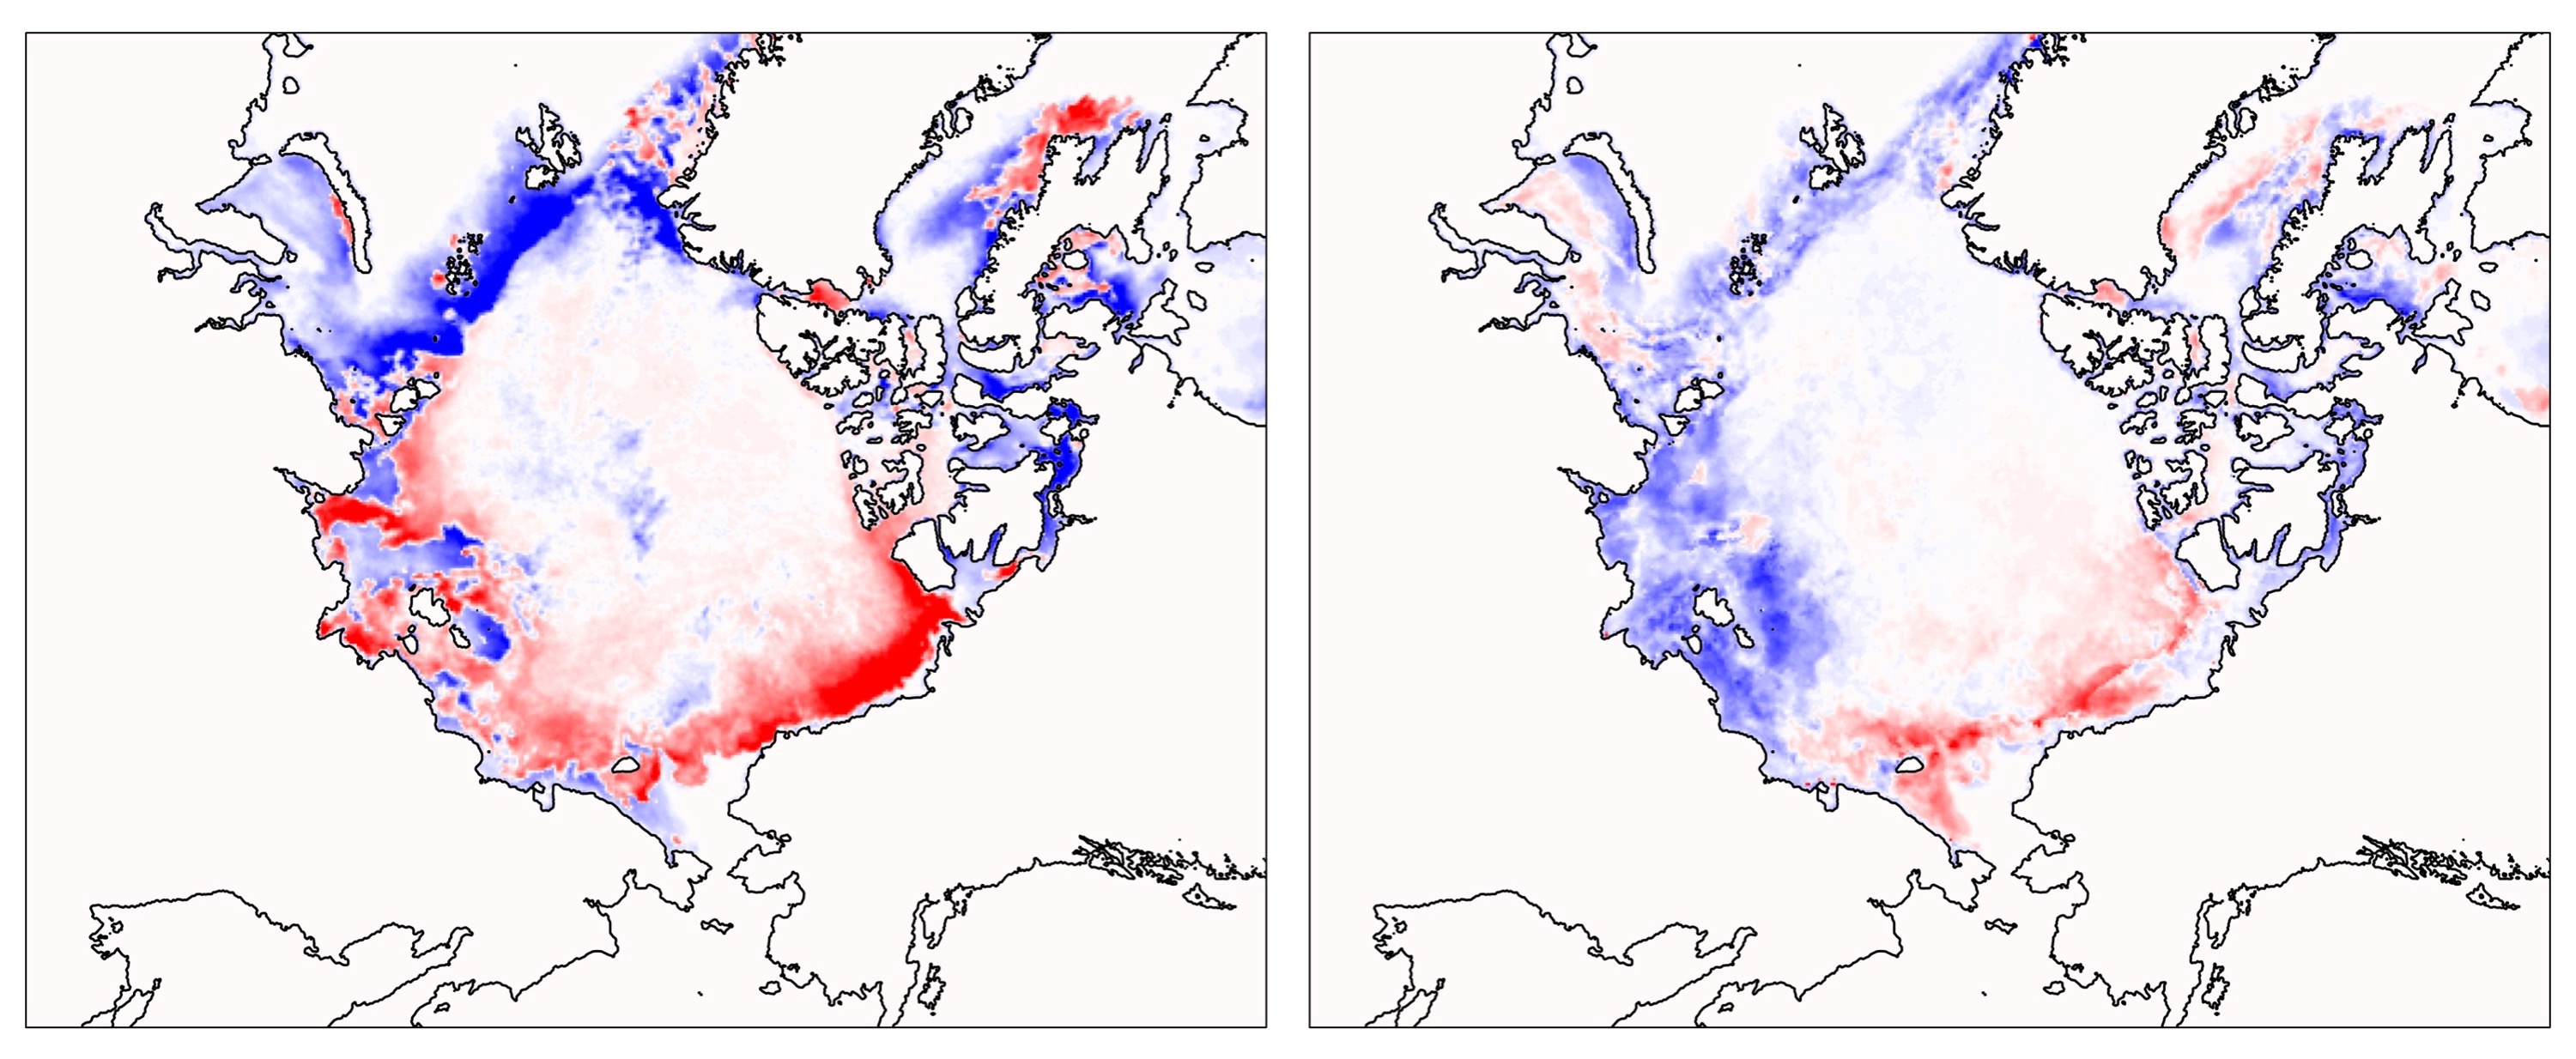
Figure 6 illustrates how both the observed and predicted distributions in Figure 5 differ from the recent average (2007–2024). The Second Report predicted that sea ice would retreat slowly (leaving more ice remaining) along the Alaskan coast and the western Siberian sector of the Arctic, whereas the retreat would be more advanced from central Siberia toward the Atlantic. In reality, the retreat has largely followed this forecast. However, from the Laptev Sea to the East Siberian Sea, more ice remains than the prediction.
You can also check the daily forecast and sea ice age data (daily and yearly) on Arctic Data archive System (ADS) at National Institute of Polar Research.

If you have any questions about satellite monitoring of the Arctic Ocean, sea ice forecasting, or the forecasting methods used here, please contact the Arctic Sea Ice Information Center (
).
The sea ice forecast and its basic research were started in GRENE, continued to ArCS and ArCS II Projects, and has been conducted in ArCS III Project since 2025.